

Dolzarb patternlar

Двойное дно
сформирован 10.04 в 12:50:19 (UTC+0)
сила сигнала 1 из 5
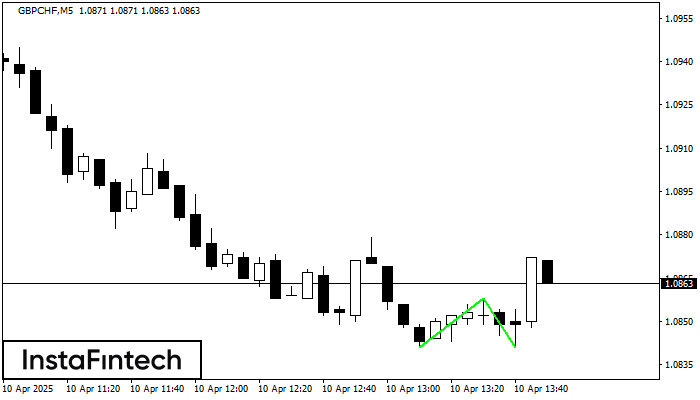
Сформирована фигура «Двойное дно» на графике GBPCHF M5. Данное формирование сигнализирует об изменении тенденции с нисходящего на восходящее движение. Сигнал: Торговую позицию на покупку следует открывать после пробоя верхней границы фигуры 1.0858, где перспектива будущего хода будет являться шириной текущей фигуры - 17 пунктов.
Таймфреймы М5 и М15 могут иметь больше ложных точек входа.
Shuningdek ko'ring
- Все
- Все
- Bearish Rectangle
- Bearish Symmetrical Triangle
- Bearish Symmetrical Triangle
- Bullish Rectangle
- Double Top
- Double Top
- Triple Bottom
- Triple Bottom
- Triple Top
- Triple Top
- Все
- Все
- Покупка
- Продажа
- Все
- 1
- 2
- 3
- 4
- 5
Bearish Rectangle
сформирован 21.11 в 09:45:42 (UTC+0)
сила сигнала 2 из 5
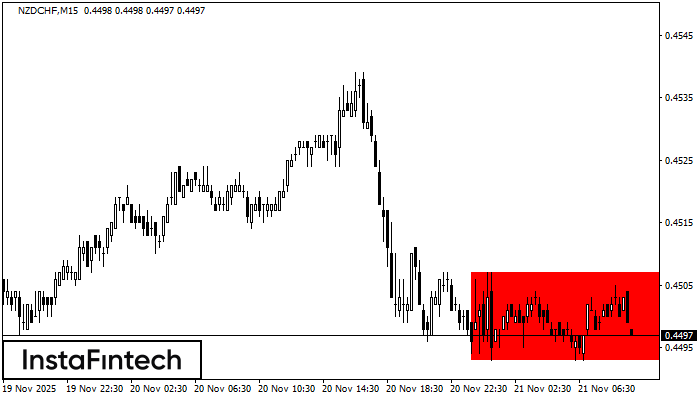
According to the chart of M15, NZDCHF formed the Bearish Rectangle. The pattern indicates a trend continuation. The upper border is 0.4507, the lower border is 0.4493. The signal means
The M5 and M15 time frames may have more false entry points.
Открыть график инструмента в новом окне
Bearish Rectangle
сформирован 21.11 в 09:45:18 (UTC+0)
сила сигнала 3 из 5
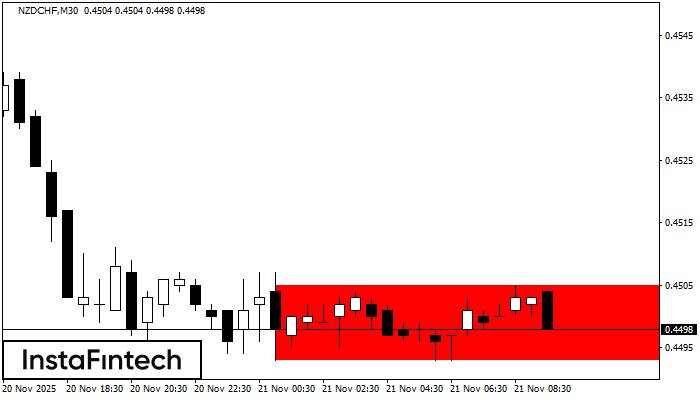
According to the chart of M30, NZDCHF formed the Bearish Rectangle which is a pattern of a trend continuation. The pattern is contained within the following borders: lower border 0.4493
Открыть график инструмента в новом окне
Bearish Symmetrical Triangle
сформирован 21.11 в 09:34:09 (UTC+0)
сила сигнала 2 из 5
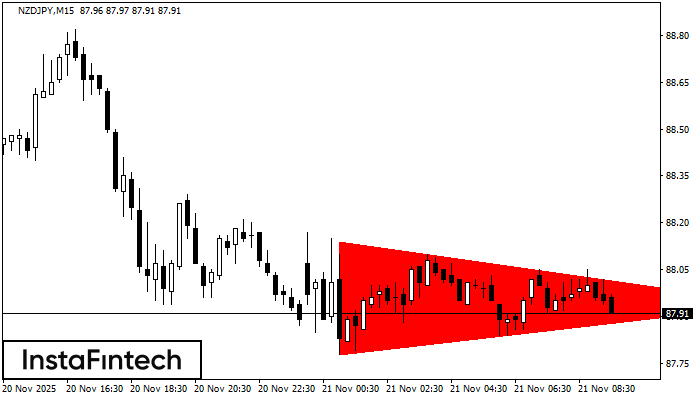
According to the chart of M15, NZDJPY formed the Bearish Symmetrical Triangle pattern. This pattern signals a further downward trend in case the lower border 87.78 is breached. Here
The M5 and M15 time frames may have more false entry points.
Открыть график инструмента в новом окне


