

Dolzarb patternlar

Двойная вершина
сформирован 10.04 в 04:00:21 (UTC+0)
сила сигнала 3 из 5
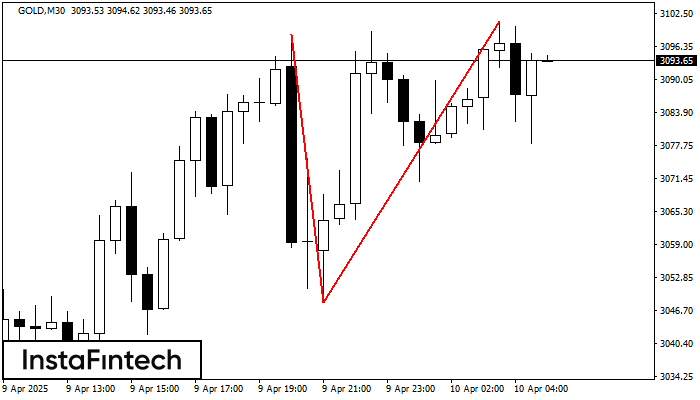
На торговом графике GOLD M30 сформировалась разворотная фигура «Двойная вершина». Характеристика: Верхняя граница 3100.96; Нижняя граница 3048.18; Ширина фигуры 5278 пунктов. Сигнал: Пробой нижней границы 3048.18 приведет к дальнейшему нисходящему движению с перспективой хода к уровню 3047.88.
Shuningdek ko'ring
- Все
- Все
- Bearish Rectangle
- Bearish Symmetrical Triangle
- Bearish Symmetrical Triangle
- Bullish Rectangle
- Double Top
- Double Top
- Triple Bottom
- Triple Bottom
- Triple Top
- Triple Top
- Все
- Все
- Покупка
- Продажа
- Все
- 1
- 2
- 3
- 4
- 5
Bullish Symmetrical Triangle
was formed on 22.09 at 20:17:21 (UTC+0)
signal strength 2 of 5
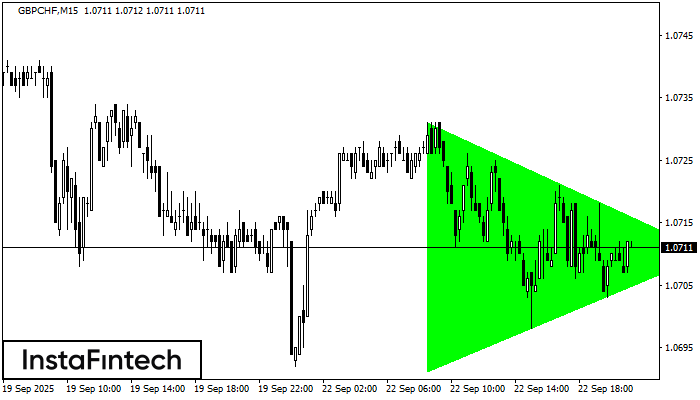
According to the chart of M15, GBPCHF formed the Bullish Symmetrical Triangle pattern. Description: This is the pattern of a trend continuation. 1.0731 and 1.0691 are the coordinates
The M5 and M15 time frames may have more false entry points.
Open chart in a new window
Bullish pennant
was formed on 22.09 at 17:45:07 (UTC+0)
signal strength 2 of 5
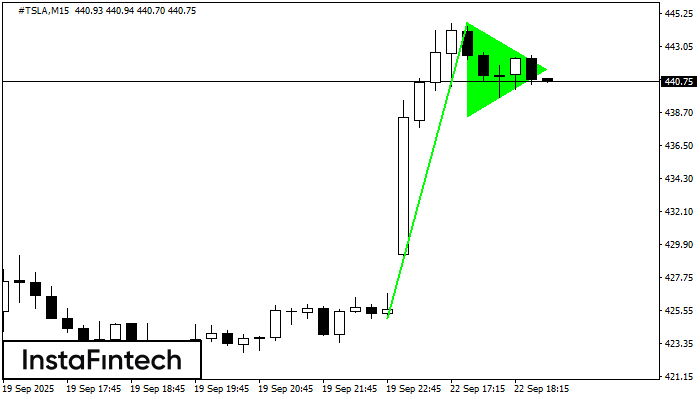
The Bullish pennant pattern is formed on the #TSLA M15 chart. It is a type of the continuation pattern. Supposedly, in case the price is fixed above the pennant’s high
The M5 and M15 time frames may have more false entry points.
Open chart in a new window
Double Bottom
was formed on 22.09 at 16:00:27 (UTC+0)
signal strength 3 of 5
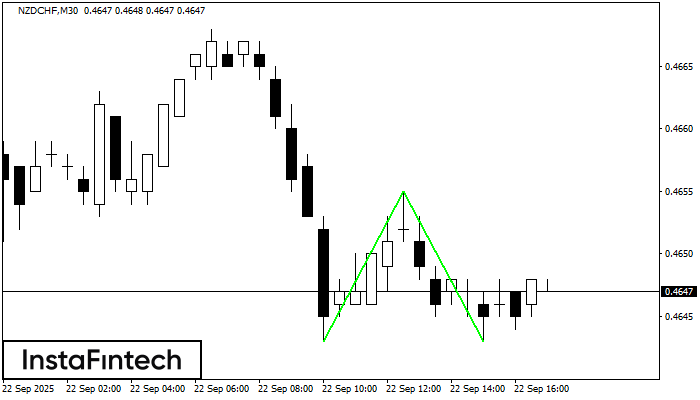
The Double Bottom pattern has been formed on NZDCHF M30; the upper boundary is 0.4655; the lower boundary is 0.4643. The width of the pattern is 12 points. In case
Open chart in a new window


