

Dolzarb patternlar

Тройная вершина
сформирован 10.04 в 00:45:31 (UTC+0)
сила сигнала 1 из 5
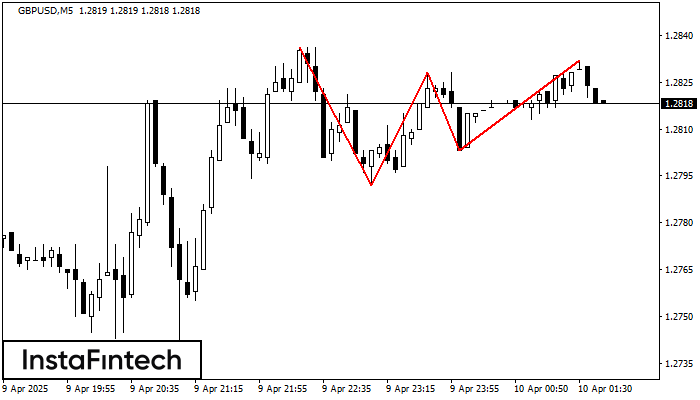
На графике GBPUSD M5 образовалась фигура «Тройная вершина». Данная фигура относится к типу разворотных и имеет характеристику: Верхняя граница 1.2836/1.2832; Нижняя граница 1.2792/1.2803; Ширина фигуры 25 пунктов. Прогноз: В случае пробоя нижней границы 1.2792 вероятно дальнейшее нисходящее движение к уровню 1.2813.
Таймфреймы М5 и М15 могут иметь больше ложных точек входа.
- Все
- Все
- Bearish Rectangle
- Bearish Symmetrical Triangle
- Bearish Symmetrical Triangle
- Bullish Rectangle
- Double Top
- Double Top
- Triple Bottom
- Triple Bottom
- Triple Top
- Triple Top
- Все
- Все
- Покупка
- Продажа
- Все
- 1
- 2
- 3
- 4
- 5
Bearish Rectangle
was formed on 27.04 at 06:31:28 (UTC+0)
signal strength 1 of 5

According to the chart of M5, #Bitcoin formed the Bearish Rectangle. The pattern indicates a trend continuation. The upper border is 94251.10, the lower border is 94078.08. The signal means
The M5 and M15 time frames may have more false entry points.
Open chart in a new window
Triple Bottom
was formed on 27.04 at 06:11:24 (UTC+0)
signal strength 1 of 5

The Triple Bottom pattern has formed on the chart of #Bitcoin M5. Features of the pattern: The lower line of the pattern has coordinates 94416.04 with the upper limit 94416.04/94251.10
The M5 and M15 time frames may have more false entry points.
Open chart in a new window
Triple Top
was formed on 26.04 at 20:16:22 (UTC+0)
signal strength 1 of 5

On the chart of the #Bitcoin M5 trading instrument, the Triple Top pattern that signals a trend change has formed. It is possible that after formation of the third peak
The M5 and M15 time frames may have more false entry points.
Open chart in a new window


