

Dolzarb patternlar

Двойное дно
сформирован 09.04 в 13:54:57 (UTC+0)
сила сигнала 1 из 5
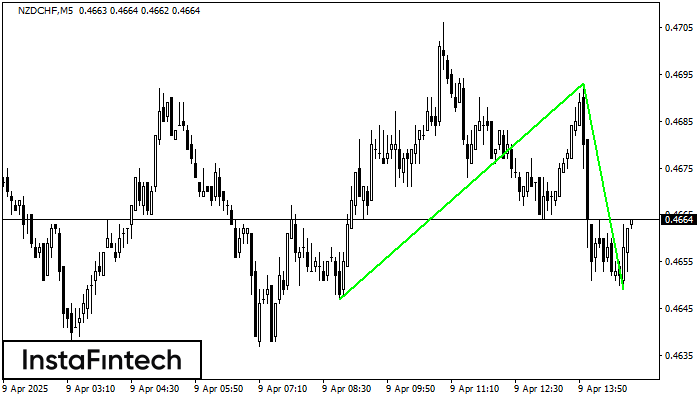
Сформирована фигура «Двойное дно» на графике NZDCHF M5. Данное формирование сигнализирует об изменении тенденции с нисходящего на восходящее движение. Сигнал: Торговую позицию на покупку следует открывать после пробоя верхней границы фигуры 0.4693, где перспектива будущего хода будет являться шириной текущей фигуры - 46 пунктов.
Таймфреймы М5 и М15 могут иметь больше ложных точек входа.
Shuningdek ko'ring
- Все
- Все
- Bearish Rectangle
- Bearish Symmetrical Triangle
- Bearish Symmetrical Triangle
- Bullish Rectangle
- Double Top
- Double Top
- Triple Bottom
- Triple Bottom
- Triple Top
- Triple Top
- Все
- Все
- Покупка
- Продажа
- Все
- 1
- 2
- 3
- 4
- 5
Double Bottom
was formed on 26.11 at 11:00:18 (UTC+0)
signal strength 4 of 5
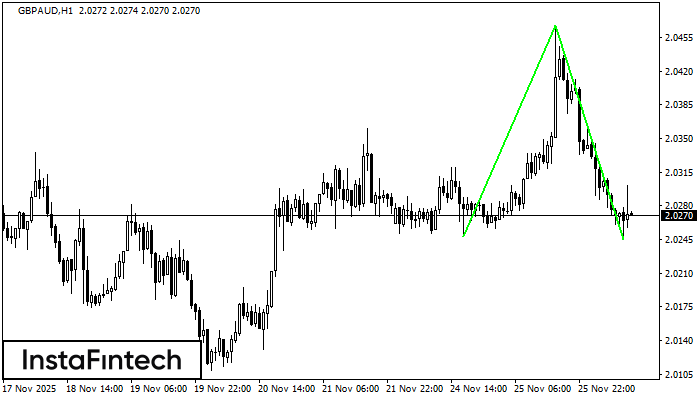
The Double Bottom pattern has been formed on GBPAUD H1; the upper boundary is 2.0468; the lower boundary is 2.0245. The width of the pattern is 220 points. In case
Open chart in a new window
Double Bottom
was formed on 26.11 at 10:30:23 (UTC+0)
signal strength 3 of 5
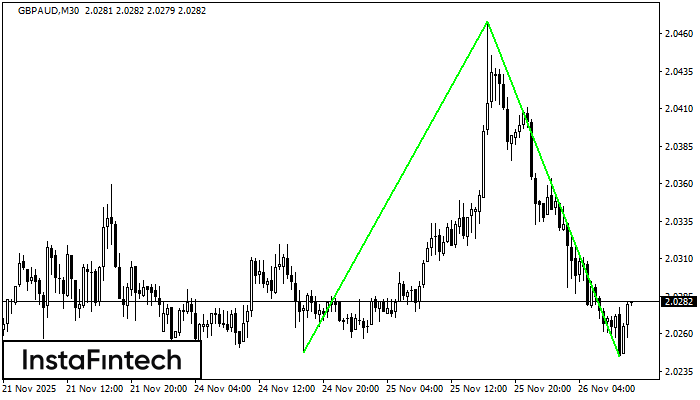
The Double Bottom pattern has been formed on GBPAUD M30. Characteristics: the support level 2.0248; the resistance level 2.0468; the width of the pattern 220 points. If the resistance level
Open chart in a new window
Double Bottom
was formed on 26.11 at 10:15:25 (UTC+0)
signal strength 2 of 5
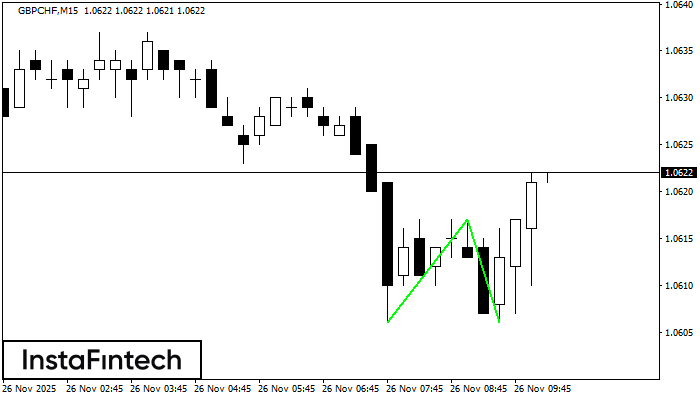
The Double Bottom pattern has been formed on GBPCHF M15; the upper boundary is 1.0617; the lower boundary is 1.0606. The width of the pattern is 11 points. In case
The M5 and M15 time frames may have more false entry points.
Open chart in a new window


