

Dolzarb patternlar

Двойное дно
сформирован 09.04 в 12:59:46 (UTC+0)
сила сигнала 2 из 5
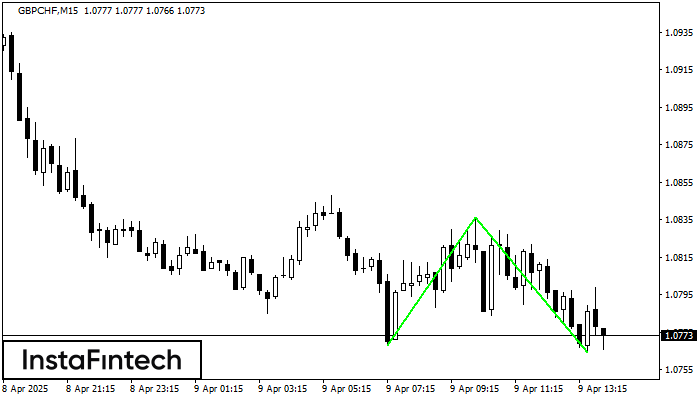
Сформирована фигура «Двойное дно» на графике GBPCHF M15. Верхняя граница 1.0836; Нижняя граница 1.0764; Ширина фигуры 68 пунктов. В случае пробоя верхней границы 1.0836 можно будет прогнозировать изменение тенденции, где ширина фигуры и будет являться расстоянием предположительного Тейк Профита.
Таймфреймы М5 и М15 могут иметь больше ложных точек входа.
Shuningdek ko'ring
- Все
- Все
- Bearish Rectangle
- Bearish Symmetrical Triangle
- Bearish Symmetrical Triangle
- Bullish Rectangle
- Double Top
- Double Top
- Triple Bottom
- Triple Bottom
- Triple Top
- Triple Top
- Все
- Все
- Покупка
- Продажа
- Все
- 1
- 2
- 3
- 4
- 5
Double Top
сформирован 06.06 в 02:15:19 (UTC+0)
сила сигнала 1 из 5
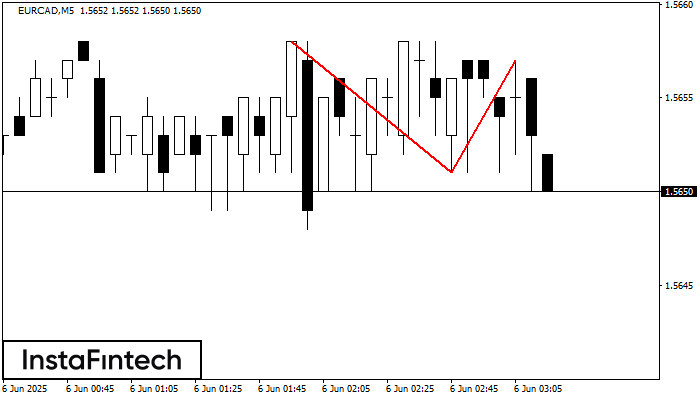
The Double Top reversal pattern has been formed on EURCAD M5. Characteristics: the upper boundary 1.5658; the lower boundary 1.5651; the width of the pattern is 6 points. Sell trades
The M5 and M15 time frames may have more false entry points.
Открыть график инструмента в новом окне
Double Bottom
сформирован 06.06 в 00:25:20 (UTC+0)
сила сигнала 1 из 5
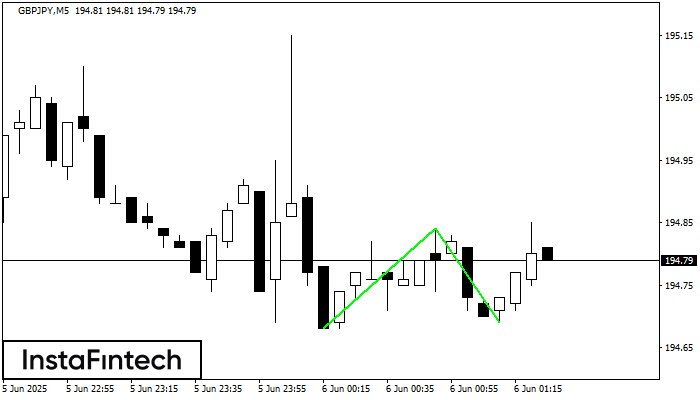
The Double Bottom pattern has been formed on GBPJPY M5. Characteristics: the support level 194.68; the resistance level 194.84; the width of the pattern 16 points. If the resistance level
The M5 and M15 time frames may have more false entry points.
Открыть график инструмента в новом окне
Double Bottom
сформирован 06.06 в 00:20:24 (UTC+0)
сила сигнала 1 из 5
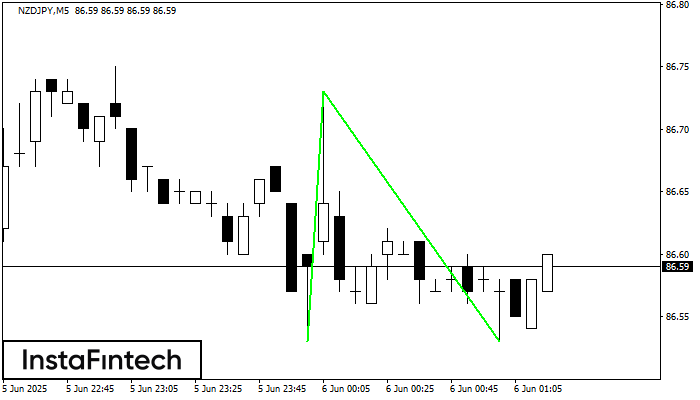
The Double Bottom pattern has been formed on NZDJPY M5; the upper boundary is 86.73; the lower boundary is 86.53. The width of the pattern is 20 points. In case
The M5 and M15 time frames may have more false entry points.
Открыть график инструмента в новом окне


