

Dolzarb patternlar

Двойное дно
сформирован 03.04 в 15:14:54 (UTC+0)
сила сигнала 2 из 5
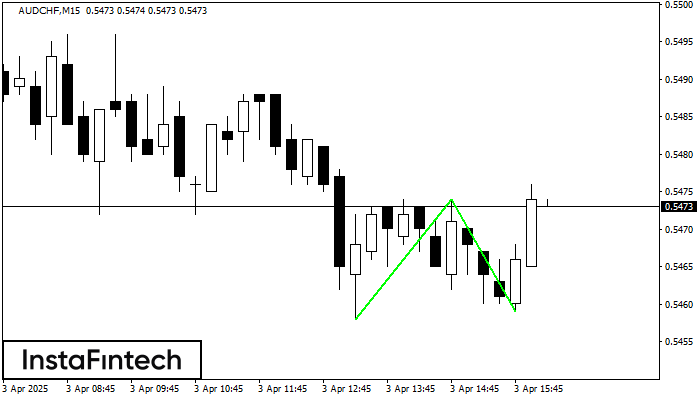
Сформирована фигура «Двойное дно» на графике AUDCHF M15. Верхняя граница 0.5474; Нижняя граница 0.5459; Ширина фигуры 16 пунктов. В случае пробоя верхней границы 0.5474 можно будет прогнозировать изменение тенденции, где ширина фигуры и будет являться расстоянием предположительного Тейк Профита.
Таймфреймы М5 и М15 могут иметь больше ложных точек входа.
- Все
- Все
- Bearish Rectangle
- Bearish Symmetrical Triangle
- Bearish Symmetrical Triangle
- Bullish Rectangle
- Double Top
- Double Top
- Triple Bottom
- Triple Bottom
- Triple Top
- Triple Top
- Все
- Все
- Покупка
- Продажа
- Все
- 1
- 2
- 3
- 4
- 5
Triple Bottom
сформирован 30.04 в 22:40:20 (UTC+0)
сила сигнала 1 из 5
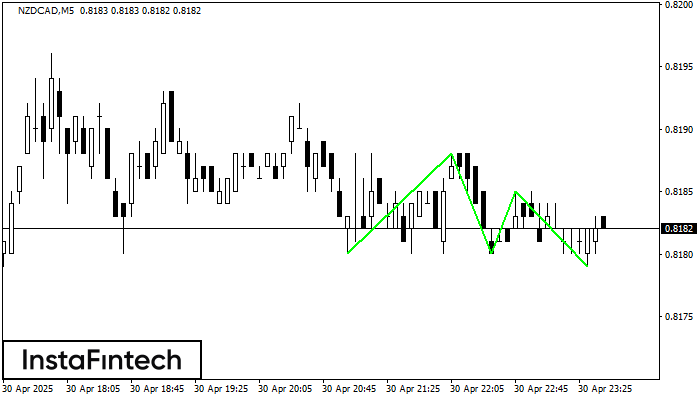
The Triple Bottom pattern has been formed on NZDCAD M5. It has the following characteristics: resistance level 0.8188/0.8185; support level 0.8180/0.8179; the width is 8 points. In the event
The M5 and M15 time frames may have more false entry points.
Открыть график инструмента в новом окне
Bullish Symmetrical Triangle
сформирован 30.04 в 21:56:12 (UTC+0)
сила сигнала 2 из 5

According to the chart of M15, #Bitcoin formed the Bullish Symmetrical Triangle pattern. The lower border of the pattern touches the coordinates 92482.78/94081.93 whereas the upper border goes across 95186.64/94081.93
The M5 and M15 time frames may have more false entry points.
Открыть график инструмента в новом окне
Double Top
сформирован 30.04 в 21:40:15 (UTC+0)
сила сигнала 1 из 5
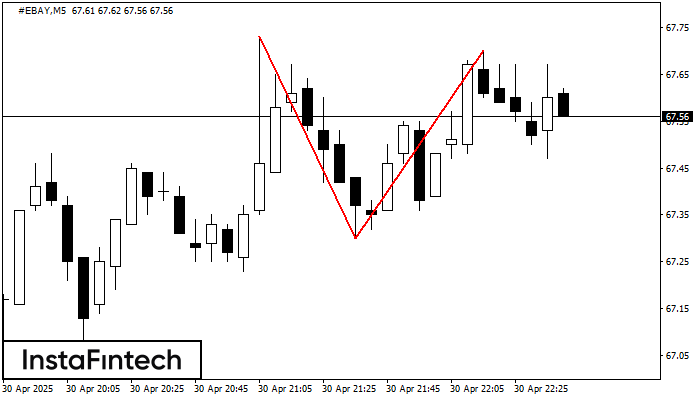
The Double Top reversal pattern has been formed on #EBAY M5. Characteristics: the upper boundary 67.73; the lower boundary 67.30; the width of the pattern is 40 points. Sell trades
The M5 and M15 time frames may have more false entry points.
Открыть график инструмента в новом окне


