

Dolzarb patternlar

Бычий флаг
сформирован 02.04 в 04:20:19 (UTC+0)
сила сигнала 1 из 5
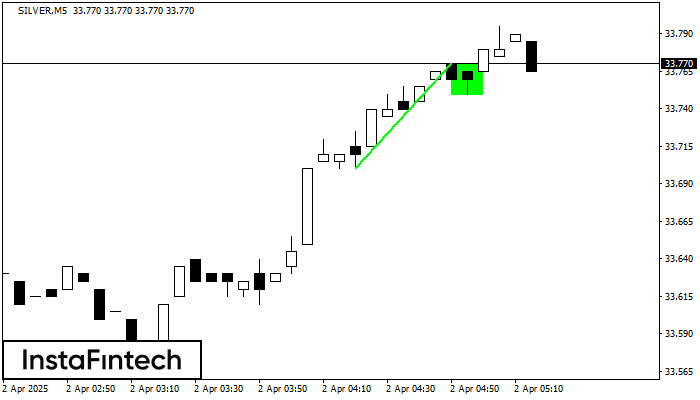
На графике SILVER M5 сформировалась фигура «Бычий флаг», которая сигнализирует о продолжении восходящего тренда. Сигналы: Пробой максимума фигуры 33.77 может привести к продолжению восходящего движения, где рост инструмента будет являться проекцией высоты флагштока.
Таймфреймы М5 и М15 могут иметь больше ложных точек входа.
- Все
- Все
- Bearish Rectangle
- Bearish Symmetrical Triangle
- Bearish Symmetrical Triangle
- Bullish Rectangle
- Double Top
- Double Top
- Triple Bottom
- Triple Bottom
- Triple Top
- Triple Top
- Все
- Все
- Покупка
- Продажа
- Все
- 1
- 2
- 3
- 4
- 5
Double Bottom
was formed on 28.04 at 19:40:14 (UTC+0)
signal strength 1 of 5
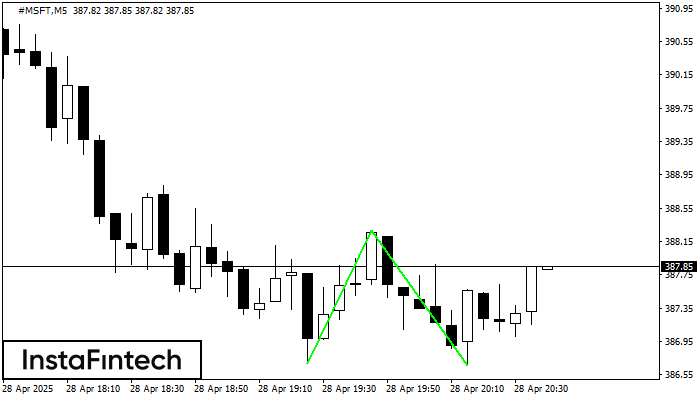
The Double Bottom pattern has been formed on #MSFT M5; the upper boundary is 388.28; the lower boundary is 386.66. The width of the pattern is 159 points. In case
The M5 and M15 time frames may have more false entry points.
Open chart in a new window
Bullish Symmetrical Triangle
was formed on 28.04 at 18:45:20 (UTC+0)
signal strength 1 of 5
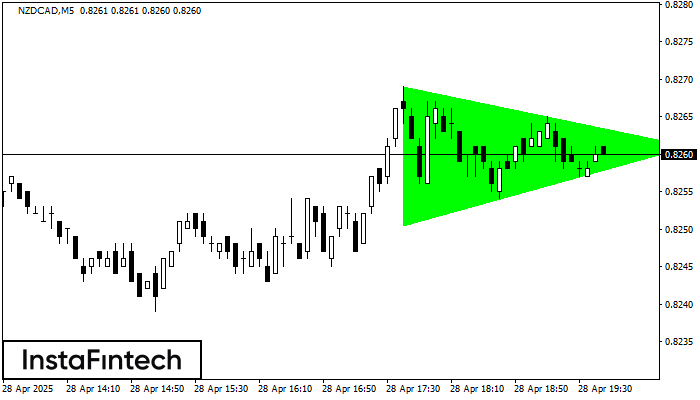
According to the chart of M5, NZDCAD formed the Bullish Symmetrical Triangle pattern. The lower border of the pattern touches the coordinates 0.8250/0.8261 whereas the upper border goes across 0.8269/0.8261
The M5 and M15 time frames may have more false entry points.
Open chart in a new window
Double Top
was formed on 28.04 at 18:35:28 (UTC+0)
signal strength 1 of 5
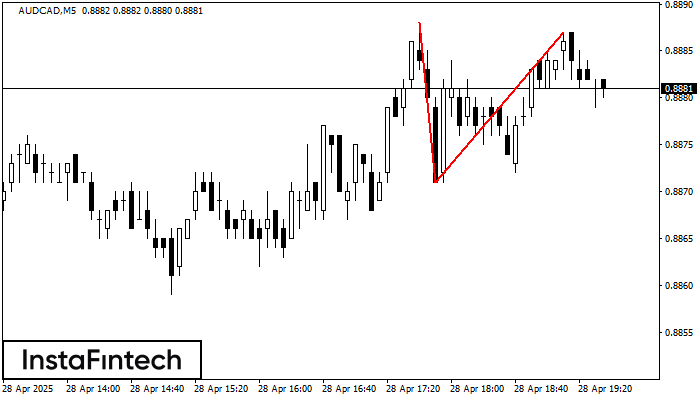
The Double Top reversal pattern has been formed on AUDCAD M5. Characteristics: the upper boundary 0.8888; the lower boundary 0.8871; the width of the pattern is 16 points. Sell trades
The M5 and M15 time frames may have more false entry points.
Open chart in a new window


