

Dolzarb patternlar

Двойное дно
сформирован 31.03 в 11:30:28 (UTC+0)
сила сигнала 2 из 5
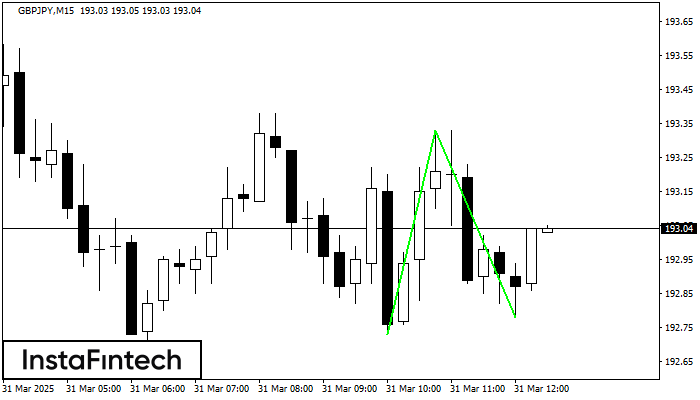
Сформирована фигура «Двойное дно» на графике GBPJPY M15. Верхняя граница 193.33; Нижняя граница 192.78; Ширина фигуры 60 пунктов. В случае пробоя верхней границы 193.33 можно будет прогнозировать изменение тенденции, где ширина фигуры и будет являться расстоянием предположительного Тейк Профита.
Таймфреймы М5 и М15 могут иметь больше ложных точек входа.
- Все
- Все
- Bearish Rectangle
- Bearish Symmetrical Triangle
- Bearish Symmetrical Triangle
- Bullish Rectangle
- Double Top
- Double Top
- Triple Bottom
- Triple Bottom
- Triple Top
- Triple Top
- Все
- Все
- Покупка
- Продажа
- Все
- 1
- 2
- 3
- 4
- 5
Double Bottom
was formed on 18.04 at 07:00:33 (UTC+0)
signal strength 1 of 5
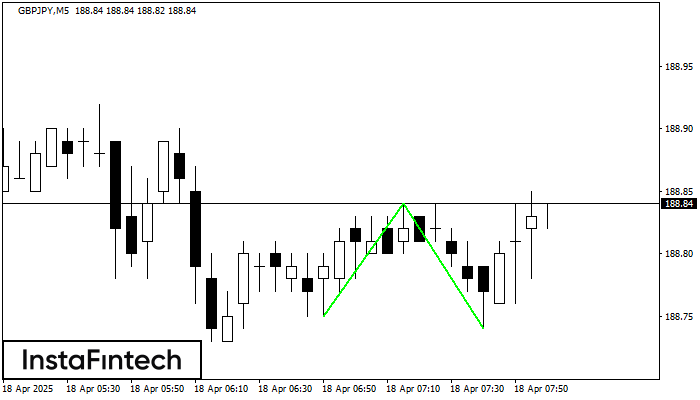
The Double Bottom pattern has been formed on GBPJPY M5; the upper boundary is 188.84; the lower boundary is 188.74. The width of the pattern is 9 points. In case
The M5 and M15 time frames may have more false entry points.
Open chart in a new window
Double Top
was formed on 18.04 at 04:45:09 (UTC+0)
signal strength 1 of 5
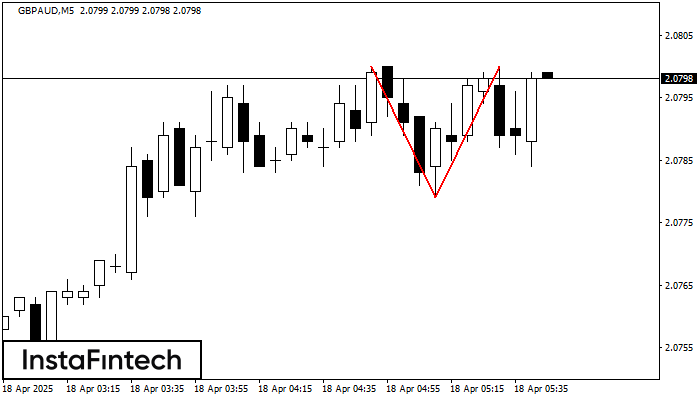
The Double Top reversal pattern has been formed on GBPAUD M5. Characteristics: the upper boundary 2.0800; the lower boundary 2.0779; the width of the pattern is 21 points. Sell trades
The M5 and M15 time frames may have more false entry points.
Open chart in a new window
Double Top
was formed on 18.04 at 04:10:38 (UTC+0)
signal strength 1 of 5
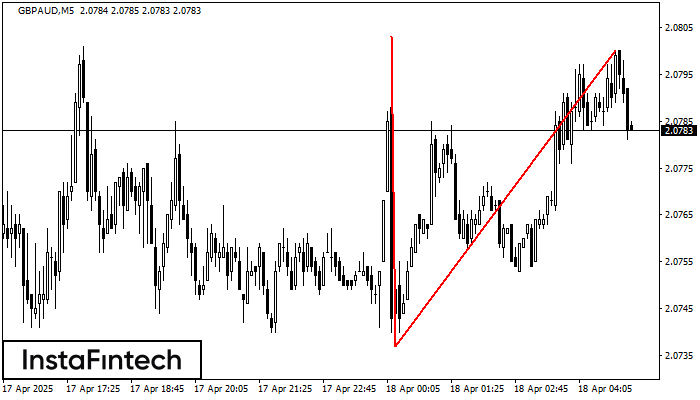
The Double Top reversal pattern has been formed on GBPAUD M5. Characteristics: the upper boundary 2.0803; the lower boundary 2.0737; the width of the pattern is 63 points. Sell trades
The M5 and M15 time frames may have more false entry points.
Open chart in a new window


