Двойное дно
сформирован 28.03 в 15:29:59 (UTC+0)
сила сигнала 3 из 5

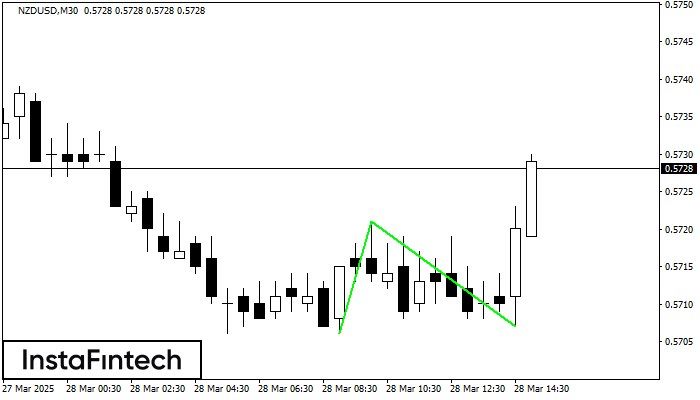
Сформирована фигура «Двойное дно» на графике NZDUSD M30. Характеристика: Уровень поддержки 0.5706; Уровень сопротивления 0.5721; Ширина фигуры 15 пунктов. В случае пробоя уровня сопротивления можно будет прогнозировать изменение тенденции, где первая точка фиксации прибыли находится на расстоянии 14 пунктов.
- Все
- Все
- Bearish Rectangle
- Bearish Symmetrical Triangle
- Bullish Rectangle
- Double Top
- Double Top
- Triple Bottom
- Triple Bottom
- Triple Top
- Triple Top
- Все
- Все
- Покупка
- Продажа
- Все
- 1
- 2
- 3
- 4
- 5
Double Top
сформирован 01.05 в 10:14:48 (UTC+0)
сила сигнала 2 из 5
The Double Top reversal pattern has been formed on USDCHF M15. Characteristics: the upper boundary 0.8286; the lower boundary 0.8267; the width of the pattern is 21 points. Sell trades
The M5 and M15 time frames may have more false entry points.
Открыть график инструмента в новом окне
Double Top
сформирован 01.05 в 10:00:10 (UTC+0)
сила сигнала 1 из 5
On the chart of GBPJPY M5 the Double Top reversal pattern has been formed. Characteristics: the upper boundary 192.14; the lower boundary 191.84; the width of the pattern 30 points
The M5 and M15 time frames may have more false entry points.
Открыть график инструмента в новом окне
Double Bottom
сформирован 01.05 в 09:59:49 (UTC+0)
сила сигнала 2 из 5
The Double Bottom pattern has been formed on EURUSD M15. Characteristics: the support level 1.1288; the resistance level 1.1312; the width of the pattern 24 points. If the resistance level
The M5 and M15 time frames may have more false entry points.
Открыть график инструмента в новом окне