

Актуальні патерни

Патерни - це графічні моделі, які "малюють" ціни на графіку. Один з постулатів технічного аналізу говорить нам про те, що історія (рух ціни) завжди повторюється. Це означає, що в схожих ситуаціях рух ціни, найчастіше, буде схожим, що дозволяє з високою часткою ймовірності спрогнозувати подальший розвиток ситуації.
Актуальні патерни від ІнстаФорекс - це зручний сервіс, який дозволить вам завжди бути в курсі останніх змін на ринку і вчасно реагувати на підказки, що з'явилися, від ринку. У нашому сервісі ви завжди знайдете найсвіжіші і актуальніші патерни на будь-якій парі і на будь-якому таймфреймі.
Тройная вершина
сформирован 24.04 в 19:20:47 (UTC+0)
сила сигнала 1 из 5
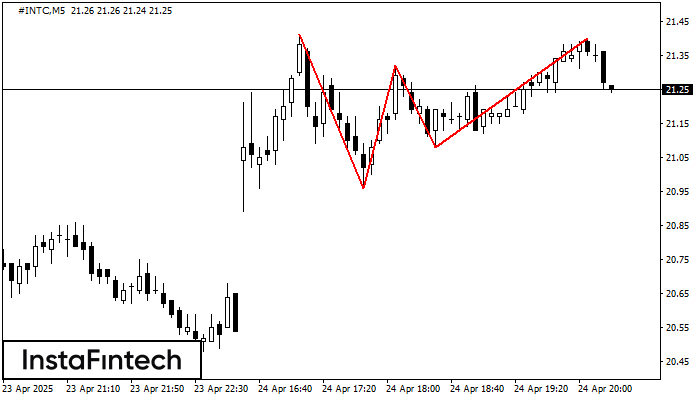
На графике #INTC M5 образовалась фигура «Тройная вершина». Данная фигура относится к типу разворотных и имеет характеристику: Верхняя граница 21.41/21.40; Нижняя граница 20.96/21.08; Ширина фигуры 24 пунктов. Прогноз: В случае пробоя нижней границы 20.96 вероятно дальнейшее нисходящее движение к уровню 21.17.
Таймфреймы М5 и М15 могут иметь больше ложных точек входа.
Дивіться також
- Все
- Все
- Bearish Rectangle
- Bearish Symmetrical Triangle
- Bearish Symmetrical Triangle
- Bullish Rectangle
- Double Top
- Double Top
- Triple Bottom
- Triple Bottom
- Triple Top
- Triple Top
- Все
- Все
- Покупка
- Продажа
- Все
- 1
- 2
- 3
- 4
- 5
Двойное дно
сформирован 07.08 в 23:00:30 (UTC+0)
сила сигнала 5 из 5
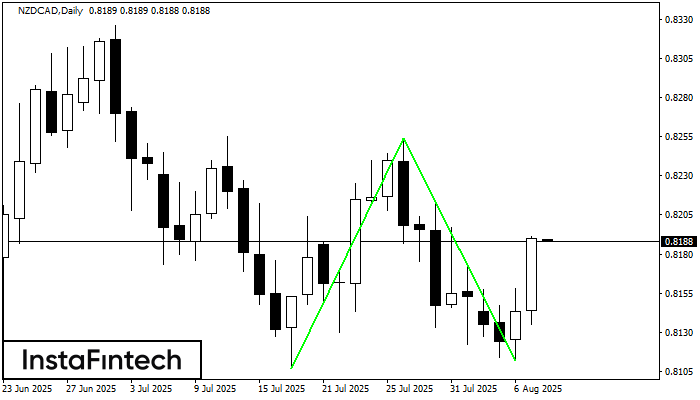
Сформирована фигура «Двойное дно» на графике NZDCAD D1. Верхняя граница 0.8254; Нижняя граница 0.8112; Ширина фигуры 147 пунктов. В случае пробоя верхней границы 0.8254 можно будет прогнозировать изменение тенденции
Открыть график инструмента в новом окне
Бычий вымпел
сформирован 07.08 в 22:47:25 (UTC+0)
сила сигнала 2 из 5
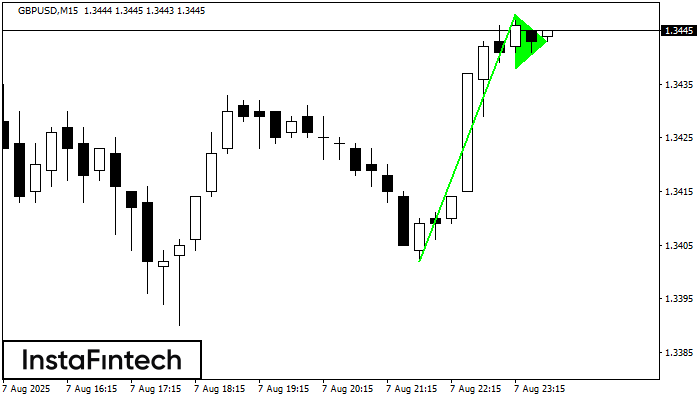
Сигнал «Бычий вымпел» – Торговый инструмент GBPUSD M15, фигура продолжения тенденции. Прогноз: позицию на покупку можно открывать выше максимума фигуры 1.3448, где перспектива будущего хода будет являться проекцией высоты флагштока
Таймфреймы М5 и М15 могут иметь больше ложных точек входа.
Открыть график инструмента в новом окне
Двойная вершина
сформирован 07.08 в 19:30:21 (UTC+0)
сила сигнала 1 из 5
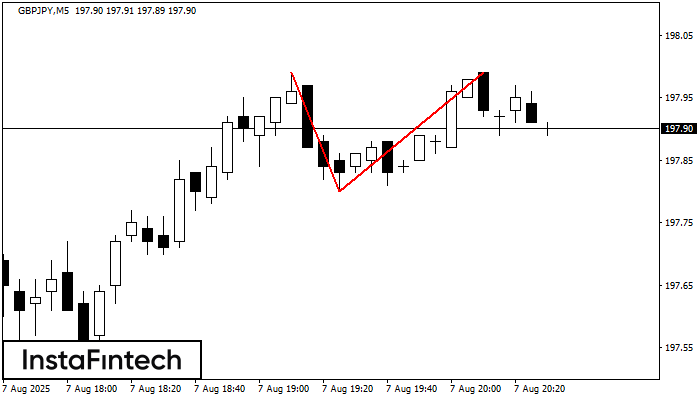
На торговом графике GBPJPY M5 сформировалась разворотная фигура «Двойная вершина». Характеристика: Верхняя граница 197.99; Нижняя граница 197.80; Ширина фигуры 19 пунктов. Сигнал: Пробой нижней границы 197.80 приведет к дальнейшему нисходящему
Таймфреймы М5 и М15 могут иметь больше ложных точек входа.
Открыть график инструмента в новом окне


