

Актуальні патерни

Патерни - це графічні моделі, які "малюють" ціни на графіку. Один з постулатів технічного аналізу говорить нам про те, що історія (рух ціни) завжди повторюється. Це означає, що в схожих ситуаціях рух ціни, найчастіше, буде схожим, що дозволяє з високою часткою ймовірності спрогнозувати подальший розвиток ситуації.
Актуальні патерни від ІнстаФорекс - це зручний сервіс, який дозволить вам завжди бути в курсі останніх змін на ринку і вчасно реагувати на підказки, що з'явилися, від ринку. У нашому сервісі ви завжди знайдете найсвіжіші і актуальніші патерни на будь-якій парі і на будь-якому таймфреймі.
Бычий симметричный треугольник
сформирован 24.04 в 01:00:53 (UTC+0)
сила сигнала 2 из 5
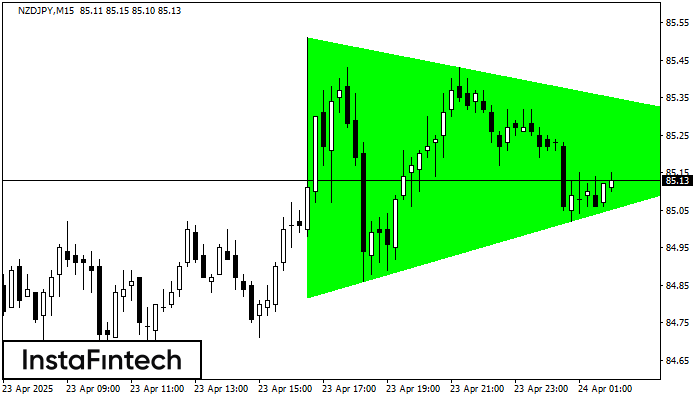
По NZDJPY на M15 фигура «Бычий симметричный треугольник». Характеристика: Фигура продолжения тренда; Координаты границ – верхняя 85.51, нижняя 84.82. Проекция ширины фигуры 69 пунктов. Прогноз: В случае пробоя верхней границы 85.51 цена, вероятнее всего, продолжит движение к 85.46.
Таймфреймы М5 и М15 могут иметь больше ложных точек входа.
- Все
- Все
- Bearish Rectangle
- Bearish Symmetrical Triangle
- Bearish Symmetrical Triangle
- Bullish Rectangle
- Double Top
- Double Top
- Triple Bottom
- Triple Bottom
- Triple Top
- Triple Top
- Все
- Все
- Покупка
- Продажа
- Все
- 1
- 2
- 3
- 4
- 5
Bearish Symmetrical Triangle
was formed on 15.05 at 23:00:07 (UTC+0)
signal strength 1 of 5
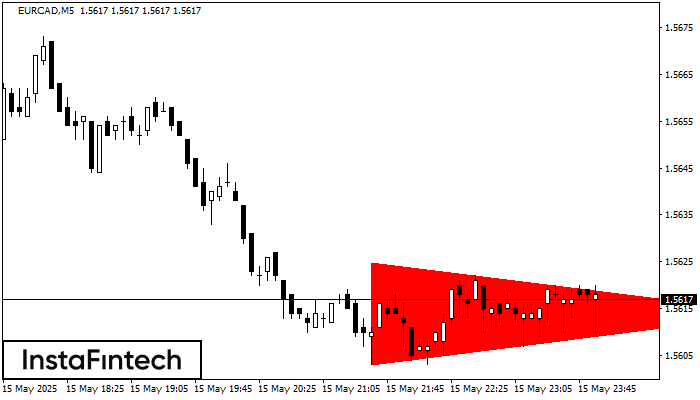
According to the chart of M5, EURCAD formed the Bearish Symmetrical Triangle pattern. Trading recommendations: A breach of the lower border 1.5603 is likely to encourage a continuation
The M5 and M15 time frames may have more false entry points.
Open chart in a new window
Bearish Rectangle
was formed on 15.05 at 22:58:25 (UTC+0)
signal strength 1 of 5
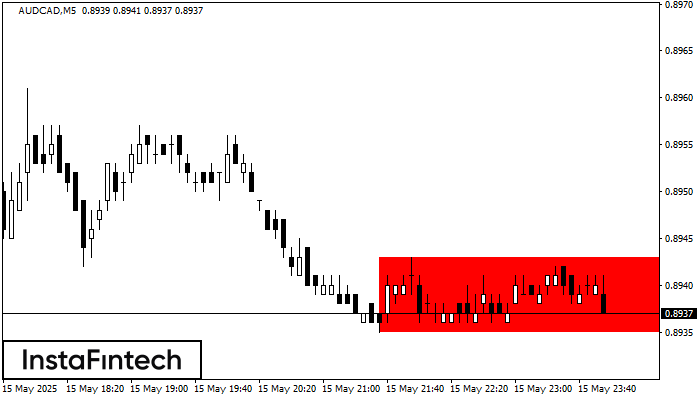
According to the chart of M5, AUDCAD formed the Bearish Rectangle. This type of a pattern indicates a trend continuation. It consists of two levels: resistance 0.8943 - 0.0000
The M5 and M15 time frames may have more false entry points.
Open chart in a new window
Triple Bottom
was formed on 15.05 at 22:30:23 (UTC+0)
signal strength 2 of 5
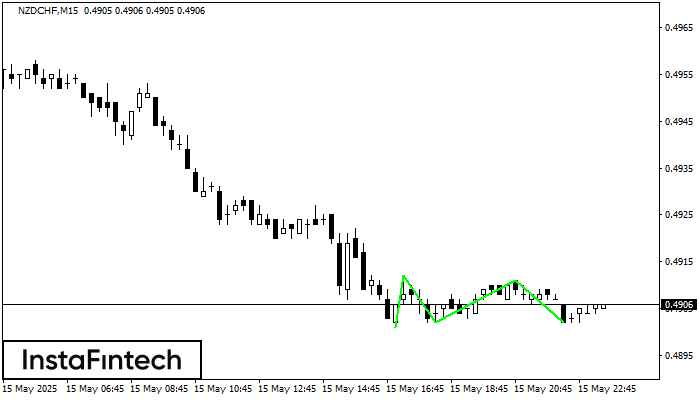
The Triple Bottom pattern has been formed on NZDCHF M15. It has the following characteristics: resistance level 0.4912/0.4911; support level 0.4901/0.4902; the width is 11 points. In the event
The M5 and M15 time frames may have more false entry points.
Open chart in a new window


