

Актуальні патерни

Патерни - це графічні моделі, які "малюють" ціни на графіку. Один з постулатів технічного аналізу говорить нам про те, що історія (рух ціни) завжди повторюється. Це означає, що в схожих ситуаціях рух ціни, найчастіше, буде схожим, що дозволяє з високою часткою ймовірності спрогнозувати подальший розвиток ситуації.
Актуальні патерни від ІнстаФорекс - це зручний сервіс, який дозволить вам завжди бути в курсі останніх змін на ринку і вчасно реагувати на підказки, що з'явилися, від ринку. У нашому сервісі ви завжди знайдете найсвіжіші і актуальніші патерни на будь-якій парі і на будь-якому таймфреймі.
Бычий симметричный треугольник
сформирован 16.04 в 03:36:20 (UTC+0)
сила сигнала 2 из 5

По AUDCAD на M15 сформировалась фигура «Бычий симметричный треугольник». Нижняя граница фигуры имеет координаты 0.8796/0.8839, при этом верхняя граница 0.8876/0.8839. Формирование фигуры «Бычий симметричный треугольник» наиболее вероятным образом свидетельствует о продолжении восходящего тренда. Это означает, что курс AUDCAD, в случае срабатывания фигуры, пробьет верхнюю границу и направится к значению 0.8862.
Таймфреймы М5 и М15 могут иметь больше ложных точек входа.
Дивіться також
- Все
- Все
- Bearish Rectangle
- Bearish Symmetrical Triangle
- Bearish Symmetrical Triangle
- Bullish Rectangle
- Double Top
- Double Top
- Triple Bottom
- Triple Bottom
- Triple Top
- Triple Top
- Все
- Все
- Покупка
- Продажа
- Все
- 1
- 2
- 3
- 4
- 5
Двойное дно
сформирован 02.06 в 15:34:51 (UTC+0)
сила сигнала 1 из 5
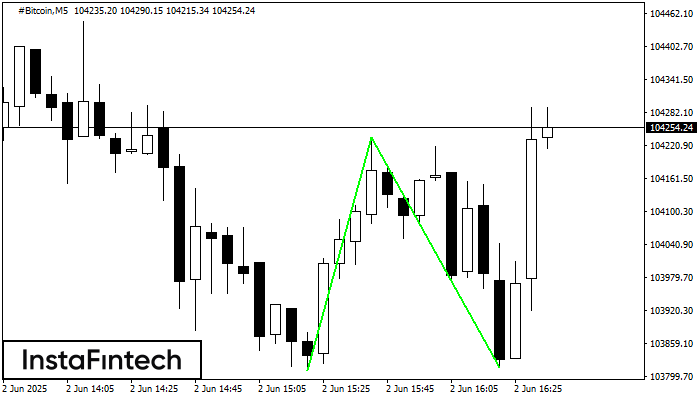
Сформирована фигура «Двойное дно» на графике #Bitcoin M5. Верхняя граница 104236.07; Нижняя граница 103815.25; Ширина фигуры 42583 пунктов. В случае пробоя верхней границы 104236.07 можно будет прогнозировать изменение тенденции
Таймфреймы М5 и М15 могут иметь больше ложных точек входа.
Открыть график инструмента в новом окне
Бычий флаг
сформирован 02.06 в 15:31:00 (UTC+0)
сила сигнала 1 из 5
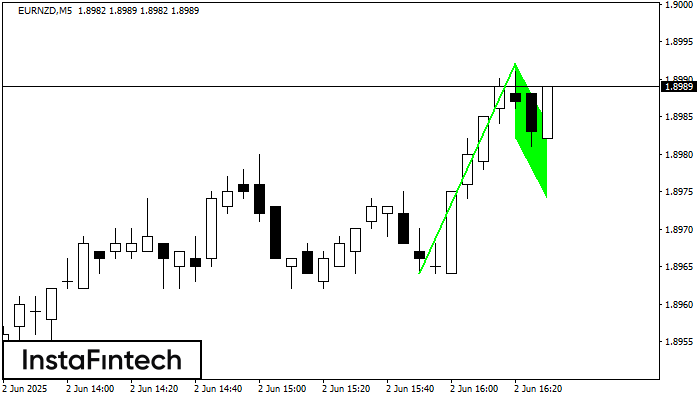
По EURNZD на M5 сформировалась фигура «Бычий флаг». Нижняя граница фигуры имеет координаты 1.8982/1.8974, при этом верхняя граница 1.8992/1.8984. Проекция высоты флагштока 28 пунктов. Формирование фигуры «Бычий флаг» наиболее вероятным
Таймфреймы М5 и М15 могут иметь больше ложных точек входа.
Открыть график инструмента в новом окне
Бычий вымпел
сформирован 02.06 в 15:30:54 (UTC+0)
сила сигнала 1 из 5
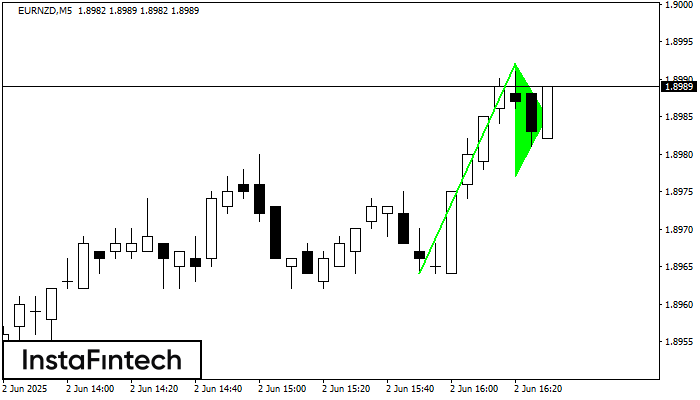
Сигнал «Бычий вымпел» – Торговый инструмент EURNZD M5, фигура продолжения тенденции. Прогноз: позицию на покупку можно открывать выше максимума фигуры 1.8992, где перспектива будущего хода будет являться проекцией высоты флагштока
Таймфреймы М5 и М15 могут иметь больше ложных точек входа.
Открыть график инструмента в новом окне


