

Актуальні патерни

Патерни - це графічні моделі, які "малюють" ціни на графіку. Один з постулатів технічного аналізу говорить нам про те, що історія (рух ціни) завжди повторюється. Це означає, що в схожих ситуаціях рух ціни, найчастіше, буде схожим, що дозволяє з високою часткою ймовірності спрогнозувати подальший розвиток ситуації.
Актуальні патерни від ІнстаФорекс - це зручний сервіс, який дозволить вам завжди бути в курсі останніх змін на ринку і вчасно реагувати на підказки, що з'явилися, від ринку. У нашому сервісі ви завжди знайдете найсвіжіші і актуальніші патерни на будь-якій парі і на будь-якому таймфреймі.
Бычий флаг
сформирован 15.04 в 13:30:54 (UTC+0)
сила сигнала 1 из 5

По USDCAD на M5 сформировалась фигура «Бычий флаг». Нижняя граница фигуры имеет координаты 1.3870/1.3862, при этом верхняя граница 1.3876/1.3868. Проекция высоты флагштока 16 пунктов. Формирование фигуры «Бычий флаг» наиболее вероятным образом свидетельствует о продолжении восходящего тренда. Это означает, что, в случае пробоя значения 1.3876, курс, вероятнее всего, продолжит движение вверх.
Таймфреймы М5 и М15 могут иметь больше ложных точек входа.
- Все
- Все
- Bearish Rectangle
- Bearish Symmetrical Triangle
- Bearish Symmetrical Triangle
- Bullish Rectangle
- Double Top
- Double Top
- Triple Bottom
- Triple Bottom
- Triple Top
- Triple Top
- Все
- Все
- Покупка
- Продажа
- Все
- 1
- 2
- 3
- 4
- 5
Double Bottom
was formed on 26.11 at 11:00:18 (UTC+0)
signal strength 4 of 5
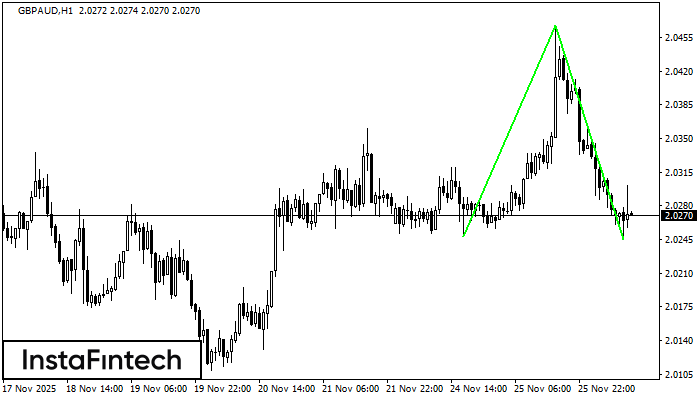
The Double Bottom pattern has been formed on GBPAUD H1; the upper boundary is 2.0468; the lower boundary is 2.0245. The width of the pattern is 220 points. In case
Open chart in a new window
Double Bottom
was formed on 26.11 at 10:30:23 (UTC+0)
signal strength 3 of 5
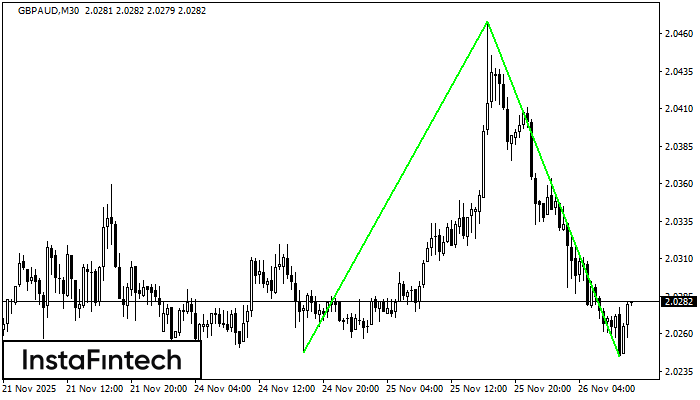
The Double Bottom pattern has been formed on GBPAUD M30. Characteristics: the support level 2.0248; the resistance level 2.0468; the width of the pattern 220 points. If the resistance level
Open chart in a new window
Double Bottom
was formed on 26.11 at 10:15:25 (UTC+0)
signal strength 2 of 5
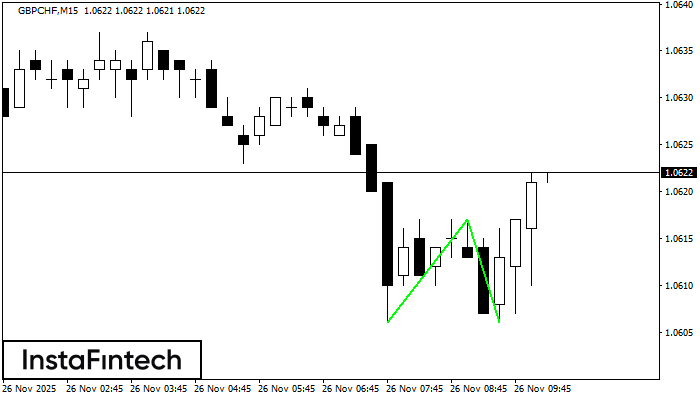
The Double Bottom pattern has been formed on GBPCHF M15; the upper boundary is 1.0617; the lower boundary is 1.0606. The width of the pattern is 11 points. In case
The M5 and M15 time frames may have more false entry points.
Open chart in a new window

