

Актуальні патерни

Патерни - це графічні моделі, які "малюють" ціни на графіку. Один з постулатів технічного аналізу говорить нам про те, що історія (рух ціни) завжди повторюється. Це означає, що в схожих ситуаціях рух ціни, найчастіше, буде схожим, що дозволяє з високою часткою ймовірності спрогнозувати подальший розвиток ситуації.
Актуальні патерни від ІнстаФорекс - це зручний сервіс, який дозволить вам завжди бути в курсі останніх змін на ринку і вчасно реагувати на підказки, що з'явилися, від ринку. У нашому сервісі ви завжди знайдете найсвіжіші і актуальніші патерни на будь-якій парі і на будь-якому таймфреймі.
Медвежий вымпел
сформирован 13.04 в 23:45:13 (UTC+0)
сила сигнала 2 из 5
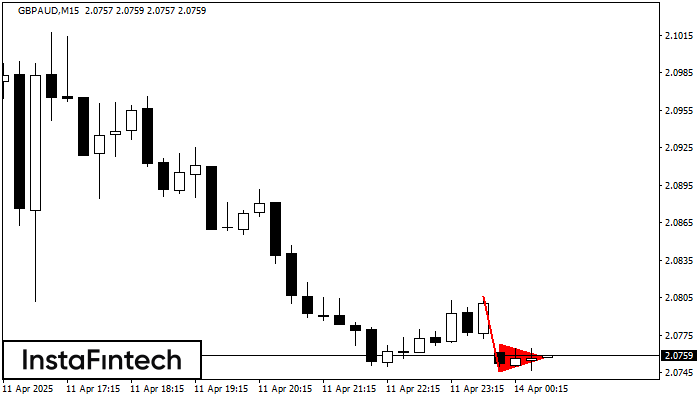
На графике GBPAUD M15 сформировалась фигура «Медвежий вымпел». Фигура сигнализирует о продолжении нисходящего тренда в случае пробоя минимума вымпела 2.0746. Рекомендации: Отложенный ордер Sell Stop выставляется на 10 пунктов ниже минимума фигуры. Тейк Профит выставляется на расстояние проекции высоты флагштока.
Таймфреймы М5 и М15 могут иметь больше ложных точек входа.
Дивіться також
- Все
- Все
- Bearish Rectangle
- Bearish Symmetrical Triangle
- Bearish Symmetrical Triangle
- Bullish Rectangle
- Double Top
- Double Top
- Triple Bottom
- Triple Bottom
- Triple Top
- Triple Top
- Все
- Все
- Покупка
- Продажа
- Все
- 1
- 2
- 3
- 4
- 5
Двойная вершина
сформирован 03.06 в 09:00:26 (UTC+0)
сила сигнала 4 из 5
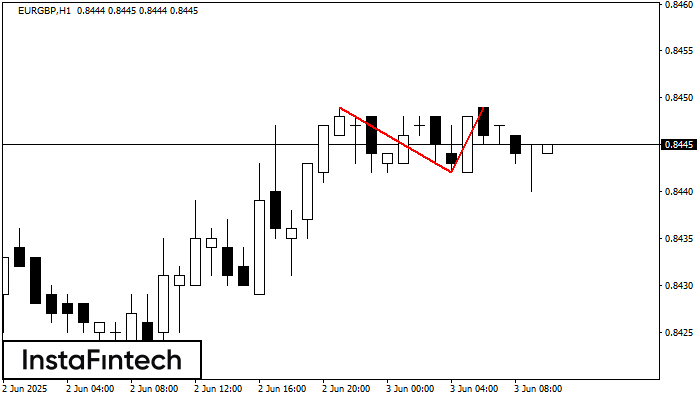
На торговом графике EURGBP H1 сформировалась разворотная фигура «Двойная вершина». Характеристика: Верхняя граница 0.8449; Нижняя граница 0.8442; Ширина фигуры 7 пунктов. Сигнал: Пробой нижней границы 0.8442 приведет к дальнейшему нисходящему
Открыть график инструмента в новом окне
Тройное дно
сформирован 03.06 в 09:00:20 (UTC+0)
сила сигнала 1 из 5
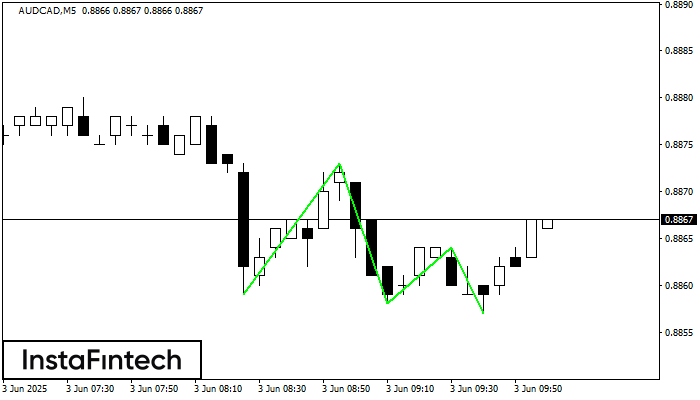
По AUDCAD на M5 сформировалась фигура «Тройное дно». Характеристика: Нижняя граница фигуры имеет координаты 0.8857, при этом верхняя граница 0.8873/0.8864. Проекция ширины 15 пунктов. Формирование фигуры «Тройное дно» наиболее вероятным
Таймфреймы М5 и М15 могут иметь больше ложных точек входа.
Открыть график инструмента в новом окне
Двойное дно
сформирован 03.06 в 08:45:32 (UTC+0)
сила сигнала 1 из 5
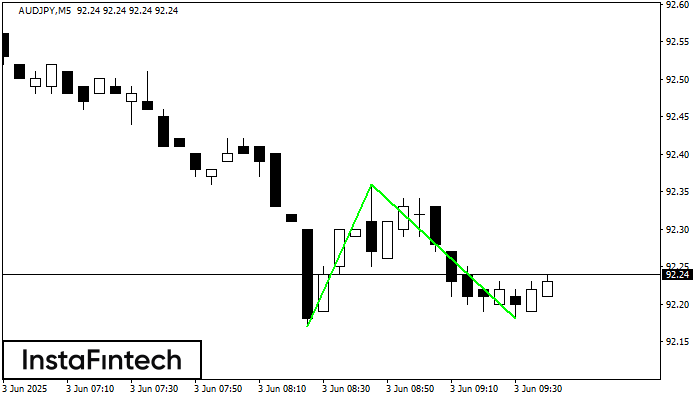
Сформирована фигура «Двойное дно» на графике AUDJPY M5. Характеристика: Уровень поддержки 92.17; Уровень сопротивления 92.36; Ширина фигуры 19 пунктов. В случае пробоя уровня сопротивления можно будет прогнозировать изменение тенденции
Таймфреймы М5 и М15 могут иметь больше ложных точек входа.
Открыть график инструмента в новом окне


