

Актуальні патерни

Патерни - це графічні моделі, які "малюють" ціни на графіку. Один з постулатів технічного аналізу говорить нам про те, що історія (рух ціни) завжди повторюється. Це означає, що в схожих ситуаціях рух ціни, найчастіше, буде схожим, що дозволяє з високою часткою ймовірності спрогнозувати подальший розвиток ситуації.
Актуальні патерни від ІнстаФорекс - це зручний сервіс, який дозволить вам завжди бути в курсі останніх змін на ринку і вчасно реагувати на підказки, що з'явилися, від ринку. У нашому сервісі ви завжди знайдете найсвіжіші і актуальніші патерни на будь-якій парі і на будь-якому таймфреймі.
Тройное дно
сформирован 10.04 в 18:30:15 (UTC+0)
сила сигнала 3 из 5
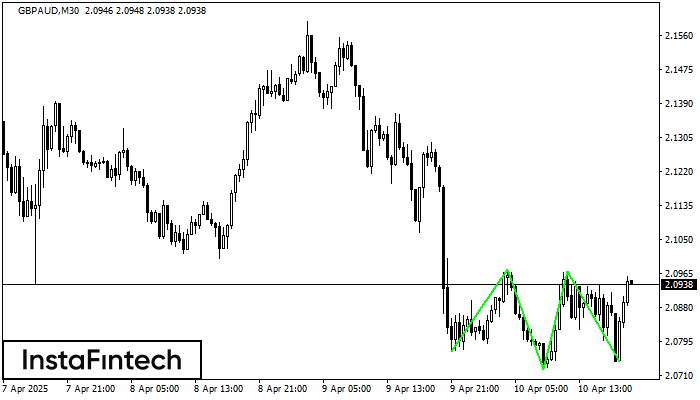
Сформирована фигура «Тройное дно» по торговому инструменту GBPAUD на M30. Фигура сигнализирует об изменении тенденции с нисходящей на восходящую в случае пробоя верхней границы 2.0969.
- Все
- Все
- Bearish Rectangle
- Bearish Symmetrical Triangle
- Bearish Symmetrical Triangle
- Bullish Rectangle
- Double Top
- Double Top
- Triple Bottom
- Triple Bottom
- Triple Top
- Triple Top
- Все
- Все
- Покупка
- Продажа
- Все
- 1
- 2
- 3
- 4
- 5
Bearish Rectangle
was formed on 02.06 at 16:03:51 (UTC+0)
signal strength 5 of 5

According to the chart of D1, #PEP formed the Bearish Rectangle. This type of a pattern indicates a trend continuation. It consists of two levels: resistance 132.70 - 0.00
Open chart in a new window
Bearish Rectangle
was formed on 02.06 at 16:03:49 (UTC+0)
signal strength 5 of 5
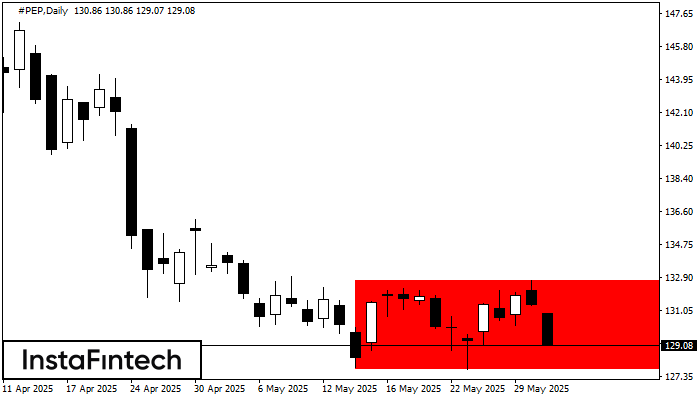
According to the chart of D1, #PEP formed the Bearish Rectangle which is a pattern of a trend continuation. The pattern is contained within the following borders: lower border 127.74
Open chart in a new window
Double Bottom
was formed on 02.06 at 15:34:51 (UTC+0)
signal strength 1 of 5
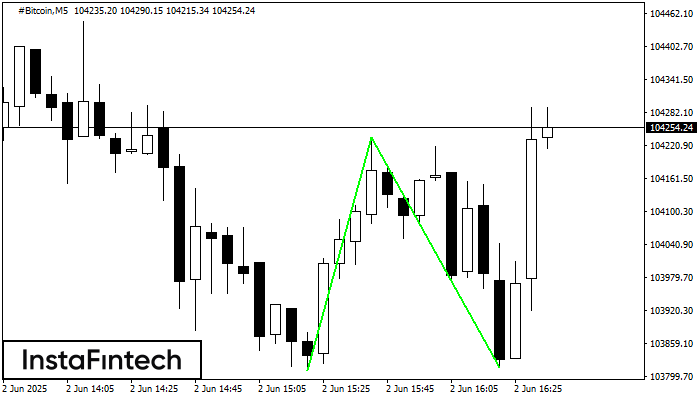
The Double Bottom pattern has been formed on #Bitcoin M5; the upper boundary is 104236.07; the lower boundary is 103815.25. The width of the pattern is 42583 points. In case
The M5 and M15 time frames may have more false entry points.
Open chart in a new window


