

Актуальні патерни

Патерни - це графічні моделі, які "малюють" ціни на графіку. Один з постулатів технічного аналізу говорить нам про те, що історія (рух ціни) завжди повторюється. Це означає, що в схожих ситуаціях рух ціни, найчастіше, буде схожим, що дозволяє з високою часткою ймовірності спрогнозувати подальший розвиток ситуації.
Актуальні патерни від ІнстаФорекс - це зручний сервіс, який дозволить вам завжди бути в курсі останніх змін на ринку і вчасно реагувати на підказки, що з'явилися, від ринку. У нашому сервісі ви завжди знайдете найсвіжіші і актуальніші патерни на будь-якій парі і на будь-якому таймфреймі.
Прямоугольник
сформирован 10.04 в 13:59:36 (UTC+0)
сила сигнала 2 из 5
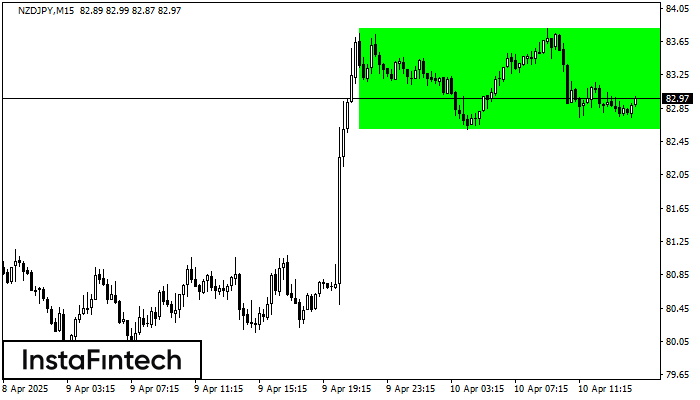
Сформирована фигура «Прямоугольник» на графике NZDJPY M15. Тип фигуры: Продолжение тренда; Границы: Верхняя 83.80, Нижняя 82.60; Сигнал: позицию на покупку следует открывать выше верхней границы прямоугольника 83.80.
Таймфреймы М5 и М15 могут иметь больше ложных точек входа.
- Все
- Все
- Bearish Rectangle
- Bearish Symmetrical Triangle
- Bearish Symmetrical Triangle
- Bullish Rectangle
- Double Top
- Double Top
- Triple Bottom
- Triple Bottom
- Triple Top
- Triple Top
- Все
- Все
- Покупка
- Продажа
- Все
- 1
- 2
- 3
- 4
- 5
Bearish pennant
was formed on 02.06 at 14:45:11 (UTC+0)
signal strength 4 of 5
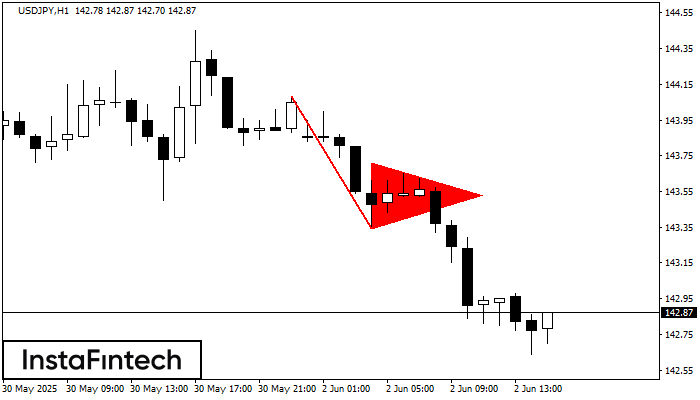
The Bearish pennant pattern has formed on the USDJPY H1 chart. It signals potential continuation of the existing trend. Specifications: the pattern’s bottom has the coordinate of 143.34; the projection
Open chart in a new window
Bullish Rectangle
was formed on 02.06 at 14:35:19 (UTC+0)
signal strength 2 of 5
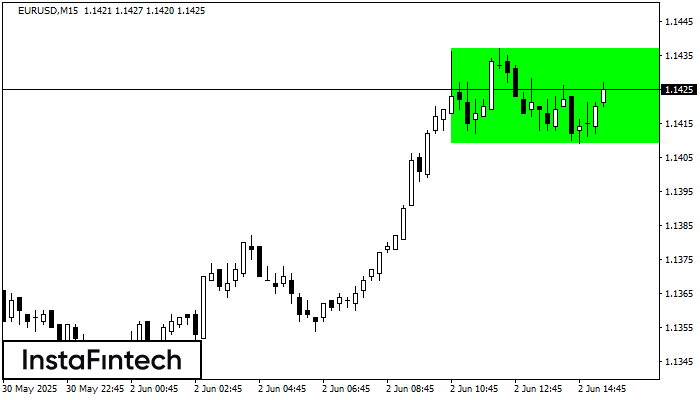
According to the chart of M15, EURUSD formed the Bullish Rectangle which is a pattern of a trend continuation. The pattern is contained within the following borders: the lower border
The M5 and M15 time frames may have more false entry points.
Open chart in a new window
Bullish Rectangle
was formed on 02.06 at 13:16:37 (UTC+0)
signal strength 1 of 5
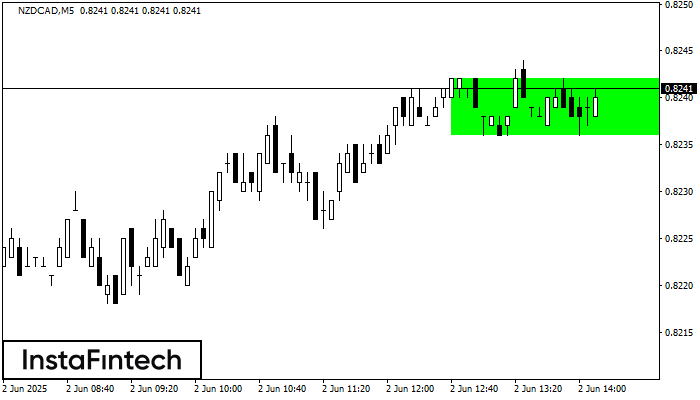
According to the chart of M5, NZDCAD formed the Bullish Rectangle. The pattern indicates a trend continuation. The upper border is 0.8242, the lower border is 0.8236. The signal means
The M5 and M15 time frames may have more false entry points.
Open chart in a new window


