

Актуальні патерни

Патерни - це графічні моделі, які "малюють" ціни на графіку. Один з постулатів технічного аналізу говорить нам про те, що історія (рух ціни) завжди повторюється. Це означає, що в схожих ситуаціях рух ціни, найчастіше, буде схожим, що дозволяє з високою часткою ймовірності спрогнозувати подальший розвиток ситуації.
Актуальні патерни від ІнстаФорекс - це зручний сервіс, який дозволить вам завжди бути в курсі останніх змін на ринку і вчасно реагувати на підказки, що з'явилися, від ринку. У нашому сервісі ви завжди знайдете найсвіжіші і актуальніші патерни на будь-якій парі і на будь-якому таймфреймі.
Бычий вымпел
сформирован 08.04 в 16:35:12 (UTC+0)
сила сигнала 1 из 5
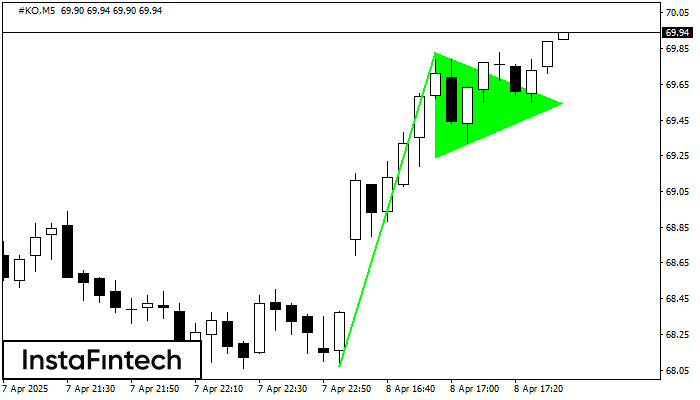
На графике #KO M5 сформировался паттерн «Бычий вымпел», который относится к фигуре продолжения тренда. Можно предполагать, что, в случае фиксации цены выше максимума вымпела 69.83, возможно дальнейшее восходящее движение.
Таймфреймы М5 и М15 могут иметь больше ложных точек входа.
- Все
- Все
- Bearish Rectangle
- Bearish Symmetrical Triangle
- Bearish Symmetrical Triangle
- Bullish Rectangle
- Double Top
- Double Top
- Triple Bottom
- Triple Bottom
- Triple Top
- Triple Top
- Все
- Все
- Покупка
- Продажа
- Все
- 1
- 2
- 3
- 4
- 5
Double Bottom
was formed on 30.05 at 09:30:30 (UTC+0)
signal strength 1 of 5
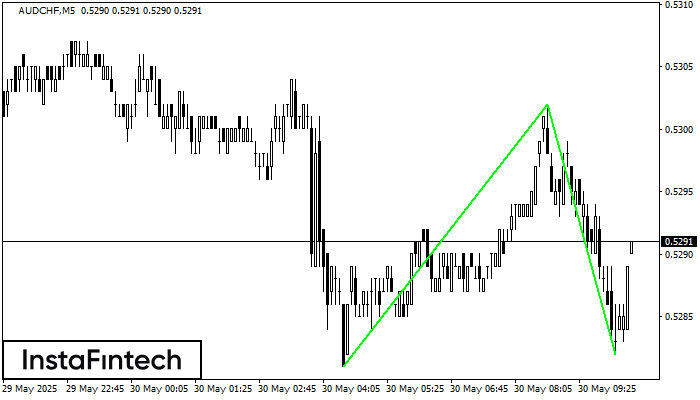
The Double Bottom pattern has been formed on AUDCHF M5. Characteristics: the support level 0.5281; the resistance level 0.5302; the width of the pattern 21 points. If the resistance level
The M5 and M15 time frames may have more false entry points.
Open chart in a new window
Double Bottom
was formed on 30.05 at 09:30:14 (UTC+0)
signal strength 2 of 5
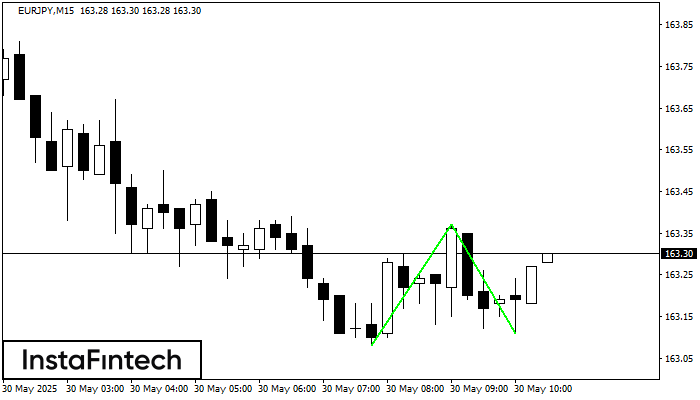
The Double Bottom pattern has been formed on EURJPY M15. Characteristics: the support level 163.08; the resistance level 163.37; the width of the pattern 29 points. If the resistance level
The M5 and M15 time frames may have more false entry points.
Open chart in a new window
Triple Bottom
was formed on 30.05 at 09:00:12 (UTC+0)
signal strength 4 of 5
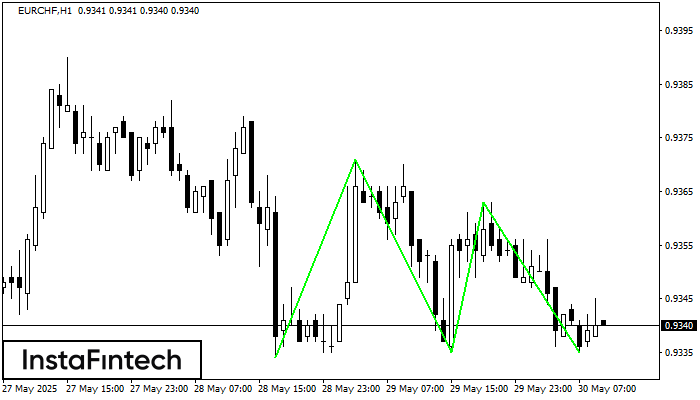
The Triple Bottom pattern has formed on the chart of EURCHF H1. Features of the pattern: The lower line of the pattern has coordinates 0.9371 with the upper limit 0.9371/0.9363
Open chart in a new window


