

Актуальні патерни

Патерни - це графічні моделі, які "малюють" ціни на графіку. Один з постулатів технічного аналізу говорить нам про те, що історія (рух ціни) завжди повторюється. Це означає, що в схожих ситуаціях рух ціни, найчастіше, буде схожим, що дозволяє з високою часткою ймовірності спрогнозувати подальший розвиток ситуації.
Актуальні патерни від ІнстаФорекс - це зручний сервіс, який дозволить вам завжди бути в курсі останніх змін на ринку і вчасно реагувати на підказки, що з'явилися, від ринку. У нашому сервісі ви завжди знайдете найсвіжіші і актуальніші патерни на будь-якій парі і на будь-якому таймфреймі.
Прямоугольник
сформирован 08.04 в 14:57:25 (UTC+0)
сила сигнала 1 из 5
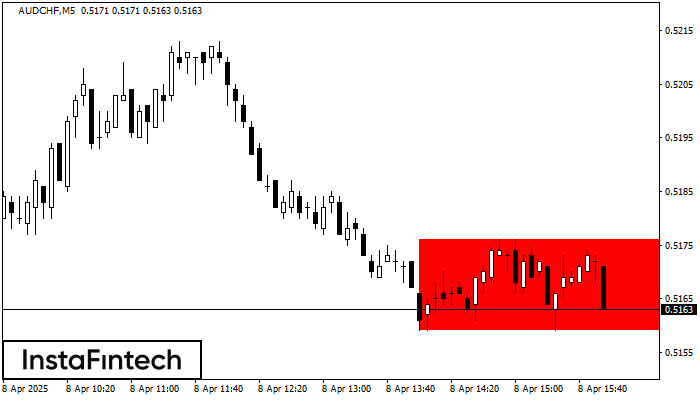
По торговому инструменту AUDCHF на M5 сформировалась фигура продолжения тренда - «Прямоугольник». Фигура имеет границы: Нижняя 0.5159; Верхняя 0.5176. В случае пробоя нижней границы вероятно дальнейшее движение в сторону тренда.
Таймфреймы М5 и М15 могут иметь больше ложных точек входа.
Дивіться також
- Все
- Все
- Bearish Rectangle
- Bearish Symmetrical Triangle
- Bearish Symmetrical Triangle
- Bullish Rectangle
- Double Top
- Double Top
- Triple Bottom
- Triple Bottom
- Triple Top
- Triple Top
- Все
- Все
- Покупка
- Продажа
- Все
- 1
- 2
- 3
- 4
- 5
Двойная вершина
сформирован 26.05 в 05:05:43 (UTC+0)
сила сигнала 1 из 5
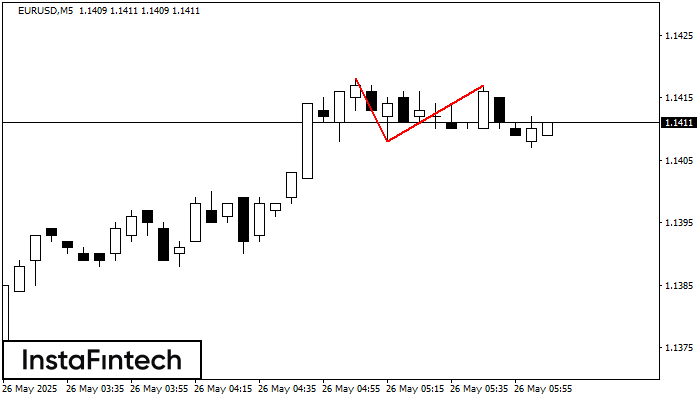
На торговом графике EURUSD M5 сформировалась разворотная фигура «Двойная вершина». Характеристика: Верхняя граница 1.1417; Нижняя граница 1.1408; Ширина фигуры 9 пунктов. Сигнал: Пробой нижней границы 1.1408 приведет к дальнейшему нисходящему
Таймфреймы М5 и М15 могут иметь больше ложных точек входа.
Открыть график инструмента в новом окне
Двойная вершина
сформирован 26.05 в 05:05:40 (UTC+0)
сила сигнала 1 из 5
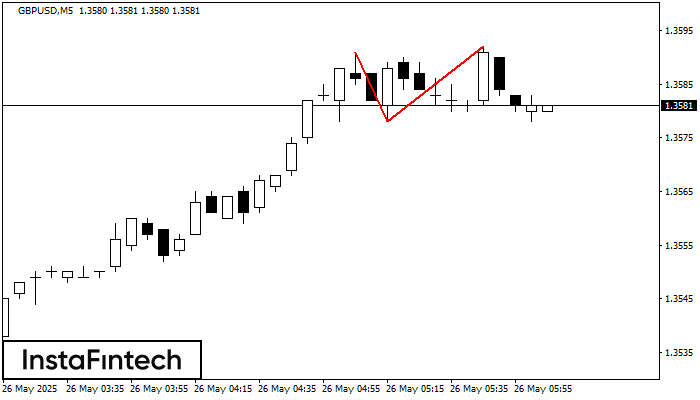
На торговом графике GBPUSD M5 сформировалась разворотная фигура «Двойная вершина». Характеристика: Верхняя граница 1.3592; Нижняя граница 1.3578; Ширина фигуры 14 пунктов. Сигнал: Пробой нижней границы 1.3578 приведет к дальнейшему нисходящему
Таймфреймы М5 и М15 могут иметь больше ложных точек входа.
Открыть график инструмента в новом окне
Двойная вершина
сформирован 26.05 в 04:15:25 (UTC+0)
сила сигнала 2 из 5
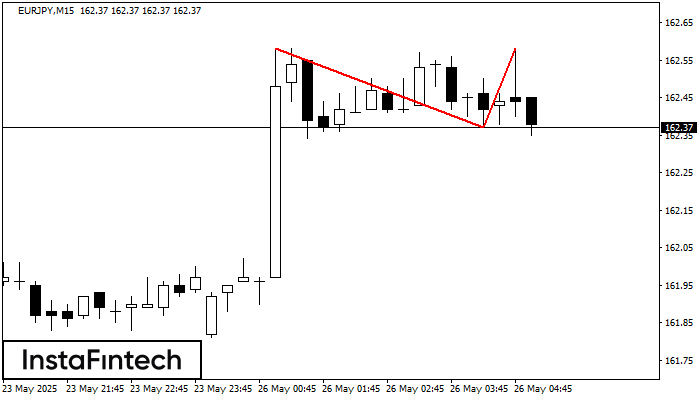
На торговом графике EURJPY M15 сформировалась разворотная фигура «Двойная вершина». Характеристика: Верхняя граница 162.58; Нижняя граница 162.37; Ширина фигуры 21 пунктов. Сигнал: Пробой нижней границы 162.37 приведет к дальнейшему нисходящему
Таймфреймы М5 и М15 могут иметь больше ложных точек входа.
Открыть график инструмента в новом окне


