

Актуальні патерни

Патерни - це графічні моделі, які "малюють" ціни на графіку. Один з постулатів технічного аналізу говорить нам про те, що історія (рух ціни) завжди повторюється. Це означає, що в схожих ситуаціях рух ціни, найчастіше, буде схожим, що дозволяє з високою часткою ймовірності спрогнозувати подальший розвиток ситуації.
Актуальні патерни від ІнстаФорекс - це зручний сервіс, який дозволить вам завжди бути в курсі останніх змін на ринку і вчасно реагувати на підказки, що з'явилися, від ринку. У нашому сервісі ви завжди знайдете найсвіжіші і актуальніші патерни на будь-якій парі і на будь-якому таймфреймі.
Двойное дно
сформирован 07.04 в 21:20:40 (UTC+0)
сила сигнала 1 из 5
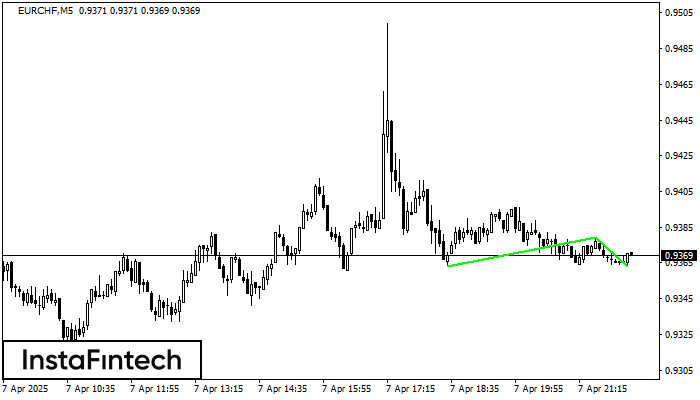
Сформирована фигура «Двойное дно» на графике EURCHF M5. Верхняя граница 0.9379; Нижняя граница 0.9363; Ширина фигуры 16 пунктов. В случае пробоя верхней границы 0.9379 можно будет прогнозировать изменение тенденции, где ширина фигуры и будет являться расстоянием предположительного Тейк Профита.
Таймфреймы М5 и М15 могут иметь больше ложных точек входа.
Дивіться також
- Все
- Все
- Bearish Rectangle
- Bearish Symmetrical Triangle
- Bearish Symmetrical Triangle
- Bullish Rectangle
- Double Top
- Double Top
- Triple Bottom
- Triple Bottom
- Triple Top
- Triple Top
- Все
- Все
- Покупка
- Продажа
- Все
- 1
- 2
- 3
- 4
- 5
Triple Top
was formed on 06.06 at 14:00:05 (UTC+0)
signal strength 2 of 5
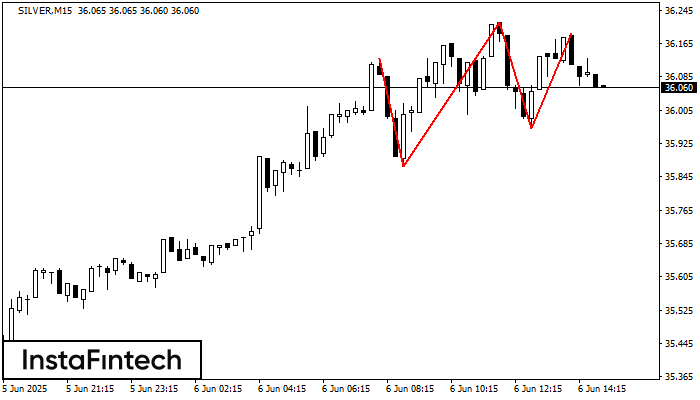
The Triple Top pattern has formed on the chart of the SILVER M15 trading instrument. It is a reversal pattern featuring the following characteristics: resistance level -60, support level -90
The M5 and M15 time frames may have more false entry points.
Open chart in a new window
Double Top
was formed on 06.06 at 13:35:14 (UTC+0)
signal strength 1 of 5
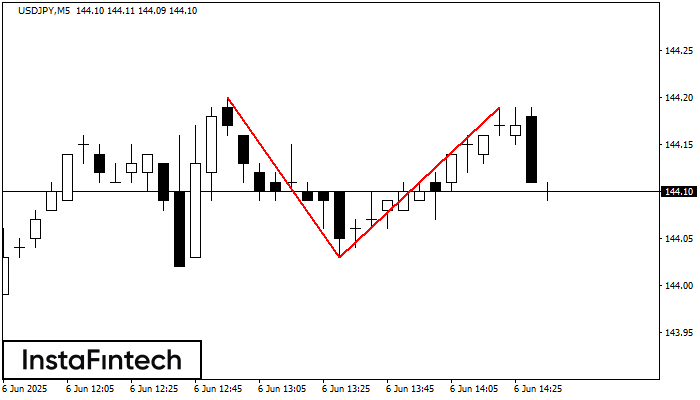
The Double Top reversal pattern has been formed on USDJPY M5. Characteristics: the upper boundary 144.20; the lower boundary 144.03; the width of the pattern is 16 points. Sell trades
The M5 and M15 time frames may have more false entry points.
Open chart in a new window
Bullish Symmetrical Triangle
was formed on 06.06 at 13:32:13 (UTC+0)
signal strength 3 of 5
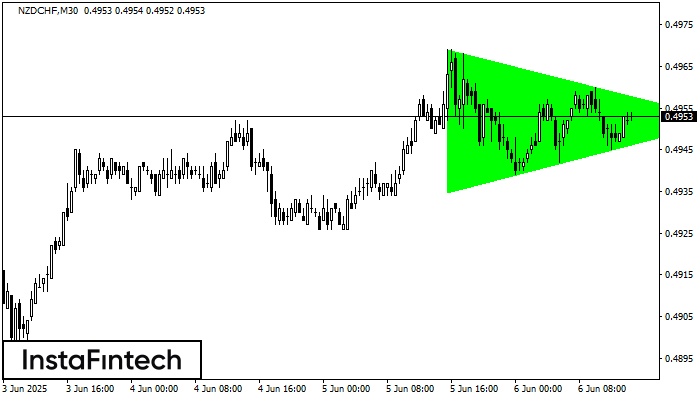
According to the chart of M30, NZDCHF formed the Bullish Symmetrical Triangle pattern. The lower border of the pattern touches the coordinates 0.4935/0.4952 whereas the upper border goes across 0.4969/0.4952
Open chart in a new window


