

Актуальні патерни

Патерни - це графічні моделі, які "малюють" ціни на графіку. Один з постулатів технічного аналізу говорить нам про те, що історія (рух ціни) завжди повторюється. Це означає, що в схожих ситуаціях рух ціни, найчастіше, буде схожим, що дозволяє з високою часткою ймовірності спрогнозувати подальший розвиток ситуації.
Актуальні патерни від ІнстаФорекс - це зручний сервіс, який дозволить вам завжди бути в курсі останніх змін на ринку і вчасно реагувати на підказки, що з'явилися, від ринку. У нашому сервісі ви завжди знайдете найсвіжіші і актуальніші патерни на будь-якій парі і на будь-якому таймфреймі.
Медвежий вымпел
сформирован 04.04 в 03:26:03 (UTC+0)
сила сигнала 1 из 5

На графике AUDCAD M5 сформировалась фигура «Медвежий вымпел», которая сигнализирует о возможном продолжении тренда. Характеристика: основание фигуры имеет координаты 0.8881; проекция высоты флагштока равна 21 пунктов. В случае если цена преодолеет основание фигуры 0.8881, то ожидается продолжение нисходящего тренда на уровень 0.8866 пунктов.
Таймфреймы М5 и М15 могут иметь больше ложных точек входа.
- Все
- Все
- Bearish Rectangle
- Bearish Symmetrical Triangle
- Bearish Symmetrical Triangle
- Bullish Rectangle
- Double Top
- Double Top
- Triple Bottom
- Triple Bottom
- Triple Top
- Triple Top
- Все
- Все
- Покупка
- Продажа
- Все
- 1
- 2
- 3
- 4
- 5
Double Top
was formed on 25.04 at 10:34:49 (UTC+0)
signal strength 1 of 5
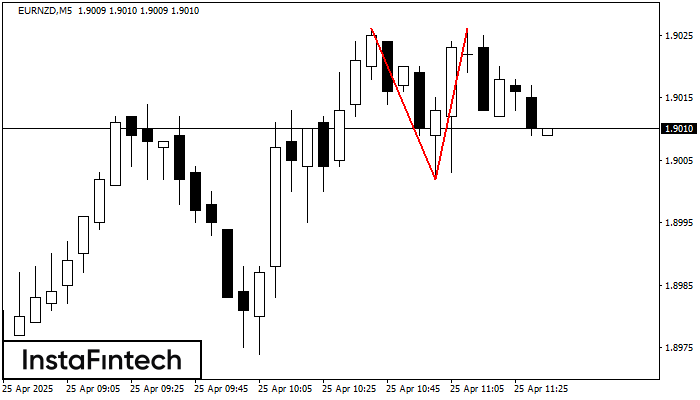
On the chart of EURNZD M5 the Double Top reversal pattern has been formed. Characteristics: the upper boundary 1.9026; the lower boundary 1.9002; the width of the pattern 24 points
The M5 and M15 time frames may have more false entry points.
Open chart in a new window
Head and Shoulders
was formed on 25.04 at 10:14:51 (UTC+0)
signal strength 1 of 5
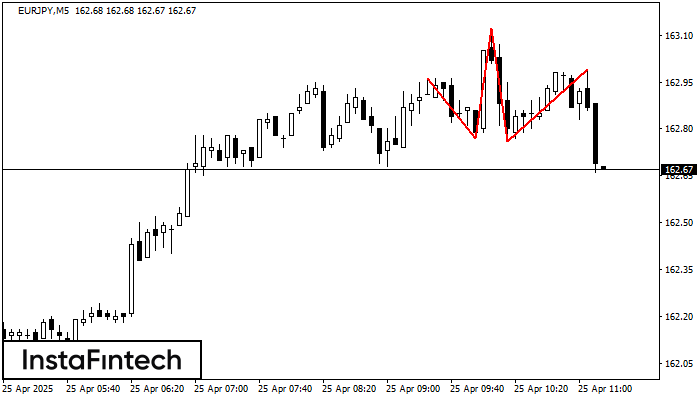
The EURJPY M5 formed the Head and Shoulders pattern with the following features: The Head’s top is at 163.12, the Neckline and the upward angle are at 162.77/162.76. The formation
The M5 and M15 time frames may have more false entry points.
Open chart in a new window
Bullish Symmetrical Triangle
was formed on 25.04 at 10:00:07 (UTC+0)
signal strength 1 of 5
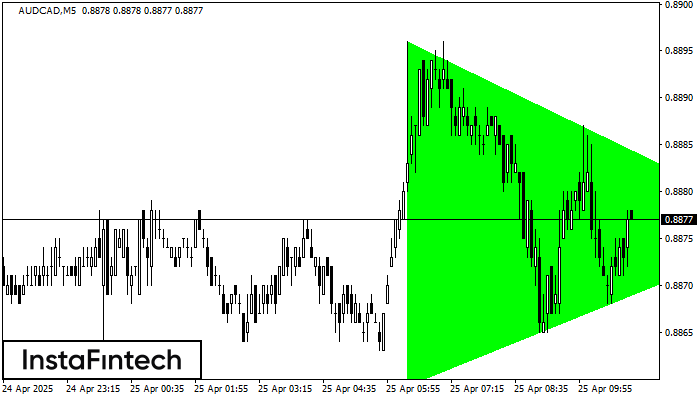
According to the chart of M5, AUDCAD formed the Bullish Symmetrical Triangle pattern, which signals the trend will continue. Description. The upper border of the pattern touches the coordinates 0.8896/0.8876
The M5 and M15 time frames may have more false entry points.
Open chart in a new window


