

Актуальні патерни

Патерни - це графічні моделі, які "малюють" ціни на графіку. Один з постулатів технічного аналізу говорить нам про те, що історія (рух ціни) завжди повторюється. Це означає, що в схожих ситуаціях рух ціни, найчастіше, буде схожим, що дозволяє з високою часткою ймовірності спрогнозувати подальший розвиток ситуації.
Актуальні патерни від ІнстаФорекс - це зручний сервіс, який дозволить вам завжди бути в курсі останніх змін на ринку і вчасно реагувати на підказки, що з'явилися, від ринку. У нашому сервісі ви завжди знайдете найсвіжіші і актуальніші патерни на будь-якій парі і на будь-якому таймфреймі.
Двойное дно
сформирован 03.04 в 17:09:50 (UTC+0)
сила сигнала 1 из 5
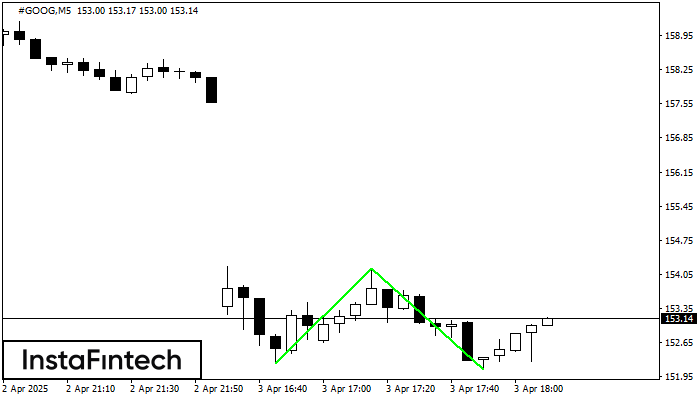
Сформирована фигура «Двойное дно» на графике #GOOG M5. Характеристика: Уровень поддержки 152.21; Уровень сопротивления 154.17; Ширина фигуры 196 пунктов. В случае пробоя уровня сопротивления можно будет прогнозировать изменение тенденции, где первая точка фиксации прибыли находится на расстоянии 207 пунктов.
Таймфреймы М5 и М15 могут иметь больше ложных точек входа.
Дивіться також
- Все
- Все
- Bearish Rectangle
- Bearish Symmetrical Triangle
- Bearish Symmetrical Triangle
- Bullish Rectangle
- Double Top
- Double Top
- Triple Bottom
- Triple Bottom
- Triple Top
- Triple Top
- Все
- Все
- Покупка
- Продажа
- Все
- 1
- 2
- 3
- 4
- 5
Triple Bottom
was formed on 29.08 at 00:30:08 (UTC+0)
signal strength 3 of 5
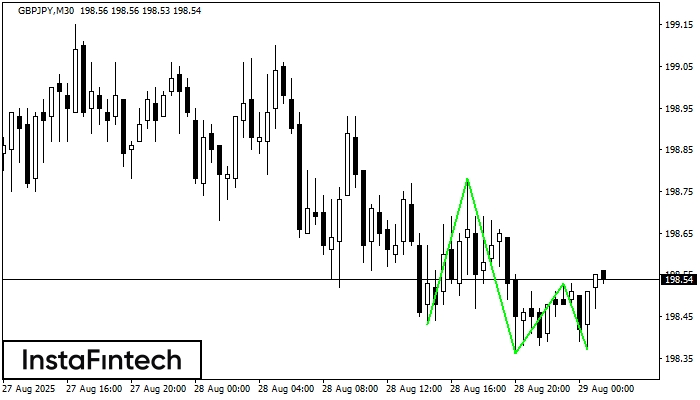
The Triple Bottom pattern has been formed on GBPJPY M30. It has the following characteristics: resistance level 198.78/198.53; support level 198.43/198.37; the width is 35 points. In the event
Open chart in a new window
Bullish Rectangle
was formed on 29.08 at 00:01:57 (UTC+0)
signal strength 1 of 5
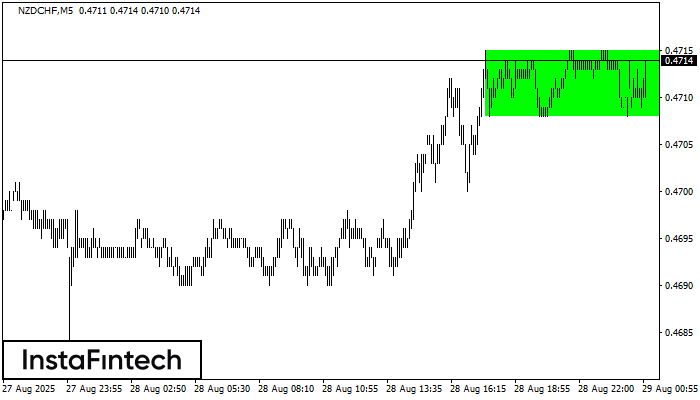
According to the chart of M5, NZDCHF formed the Bullish Rectangle. This type of a pattern indicates a trend continuation. It consists of two levels: resistance 0.4715 and support 0.4708
The M5 and M15 time frames may have more false entry points.
Open chart in a new window
Double Top
was formed on 28.08 at 23:30:26 (UTC+0)
signal strength 3 of 5
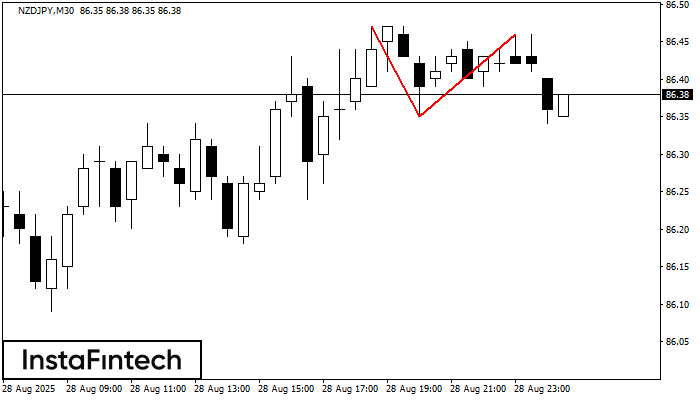
On the chart of NZDJPY M30 the Double Top reversal pattern has been formed. Characteristics: the upper boundary 86.46; the lower boundary 86.35; the width of the pattern 11 points
Open chart in a new window


