

Актуальні патерни

Патерни - це графічні моделі, які "малюють" ціни на графіку. Один з постулатів технічного аналізу говорить нам про те, що історія (рух ціни) завжди повторюється. Це означає, що в схожих ситуаціях рух ціни, найчастіше, буде схожим, що дозволяє з високою часткою ймовірності спрогнозувати подальший розвиток ситуації.
Актуальні патерни від ІнстаФорекс - це зручний сервіс, який дозволить вам завжди бути в курсі останніх змін на ринку і вчасно реагувати на підказки, що з'явилися, від ринку. У нашому сервісі ви завжди знайдете найсвіжіші і актуальніші патерни на будь-якій парі і на будь-якому таймфреймі.
Медвежий вымпел
сформирован 03.04 в 16:04:54 (UTC+0)
сила сигнала 1 из 5
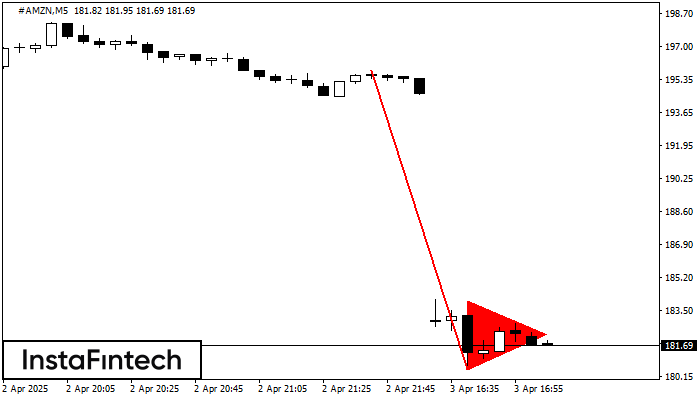
По торговому инструменту #AMZN на M5 сформировалась графическая фигура «Медвежий вымпел». Фигура данного типа характеризует небольшое замедление, после которого движение продолжится в исходном тренде. В случае если котировке удастся зафиксироваться ниже минимума образованной фигуры 180.49, трейдеру представится возможность удачно войти в позицию на продажу.
Таймфреймы М5 и М15 могут иметь больше ложных точек входа.
- Все
- Все
- Bearish Rectangle
- Bearish Symmetrical Triangle
- Bearish Symmetrical Triangle
- Bullish Rectangle
- Double Top
- Double Top
- Triple Bottom
- Triple Bottom
- Triple Top
- Triple Top
- Все
- Все
- Покупка
- Продажа
- Все
- 1
- 2
- 3
- 4
- 5
Double Bottom
was formed on 14.05 at 16:50:44 (UTC+0)
signal strength 1 of 5
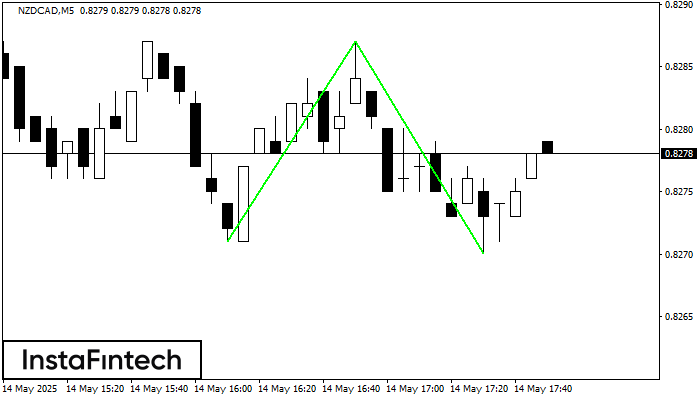
The Double Bottom pattern has been formed on NZDCAD M5. Characteristics: the support level 0.8271; the resistance level 0.8287; the width of the pattern 16 points. If the resistance level
The M5 and M15 time frames may have more false entry points.
Open chart in a new window
Double Bottom
was formed on 14.05 at 16:50:17 (UTC+0)
signal strength 1 of 5
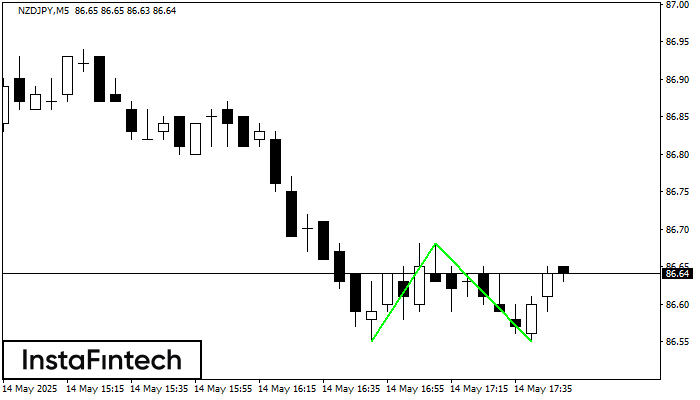
The Double Bottom pattern has been formed on NZDJPY M5. Characteristics: the support level 86.55; the resistance level 86.68; the width of the pattern 13 points. If the resistance level
The M5 and M15 time frames may have more false entry points.
Open chart in a new window
Bearish Flag
was formed on 14.05 at 16:32:33 (UTC+0)
signal strength 1 of 5
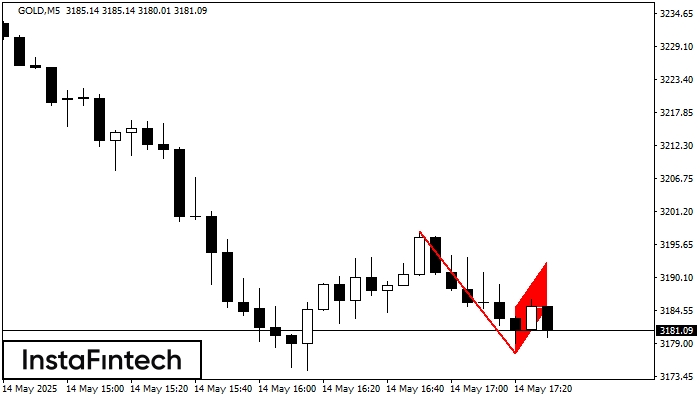
The Bearish Flag pattern has been formed on GOLD at M5. The lower boundary of the pattern is located at 3177.35/3185.07 while the upper boundary lies at 3185.27/3192.99. The projection
The M5 and M15 time frames may have more false entry points.
Open chart in a new window


