

Актуальні патерни

Патерни - це графічні моделі, які "малюють" ціни на графіку. Один з постулатів технічного аналізу говорить нам про те, що історія (рух ціни) завжди повторюється. Це означає, що в схожих ситуаціях рух ціни, найчастіше, буде схожим, що дозволяє з високою часткою ймовірності спрогнозувати подальший розвиток ситуації.
Актуальні патерни від ІнстаФорекс - це зручний сервіс, який дозволить вам завжди бути в курсі останніх змін на ринку і вчасно реагувати на підказки, що з'явилися, від ринку. У нашому сервісі ви завжди знайдете найсвіжіші і актуальніші патерни на будь-якій парі і на будь-якому таймфреймі.
Прямоугольник
сформирован 24.03 в 03:53:59 (UTC+0)
сила сигнала 3 из 5
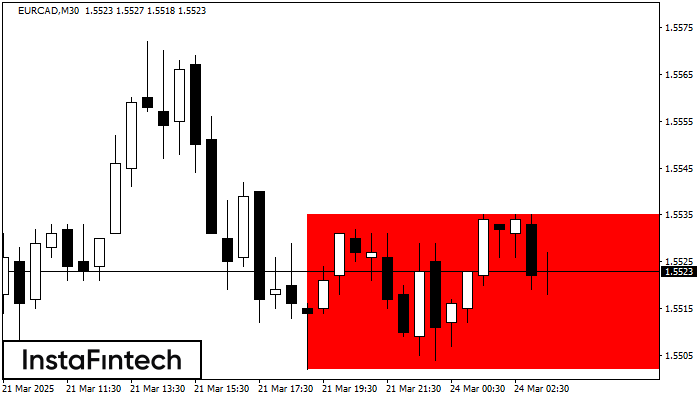
Сформирована фигура «Прямоугольник» на графике EURCAD M30. Тип фигуры: Продолжение тренда; Границы: Верхняя 1.5535, Нижняя 1.5502; Сигнал: позиция на продажу открывается после фиксации цены ниже границы прямоугольника 1.5502.
Дивіться також
- Все
- Все
- Bearish Rectangle
- Bearish Symmetrical Triangle
- Bearish Symmetrical Triangle
- Bullish Rectangle
- Double Top
- Double Top
- Triple Bottom
- Triple Bottom
- Triple Top
- Triple Top
- Все
- Все
- Покупка
- Продажа
- Все
- 1
- 2
- 3
- 4
- 5
Double Top
сформирован 27.05 в 21:35:15 (UTC+0)
сила сигнала 1 из 5
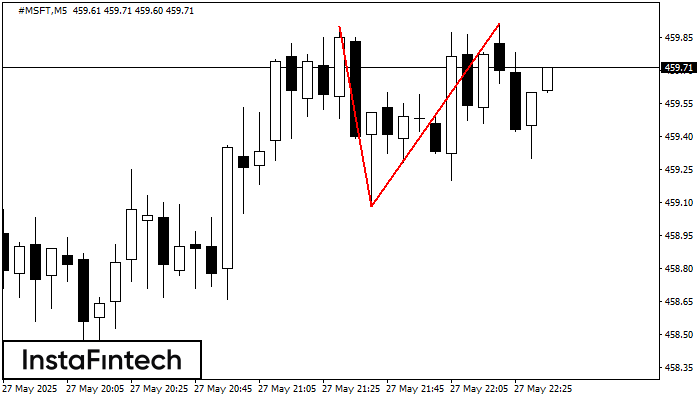
On the chart of #MSFT M5 the Double Top reversal pattern has been formed. Characteristics: the upper boundary 459.91; the lower boundary 459.08; the width of the pattern 83 points
The M5 and M15 time frames may have more false entry points.
Открыть график инструмента в новом окне
Double Top
сформирован 27.05 в 21:30:25 (UTC+0)
сила сигнала 1 из 5
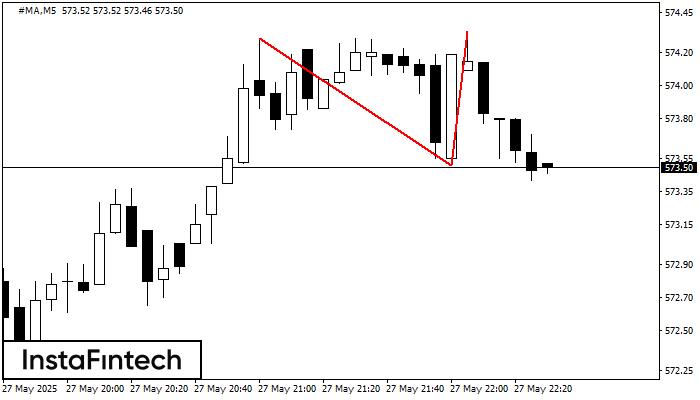
On the chart of #MA M5 the Double Top reversal pattern has been formed. Characteristics: the upper boundary 574.33; the lower boundary 573.51; the width of the pattern 82 points
The M5 and M15 time frames may have more false entry points.
Открыть график инструмента в новом окне
Triple Top
сформирован 27.05 в 21:20:19 (UTC+0)
сила сигнала 1 из 5
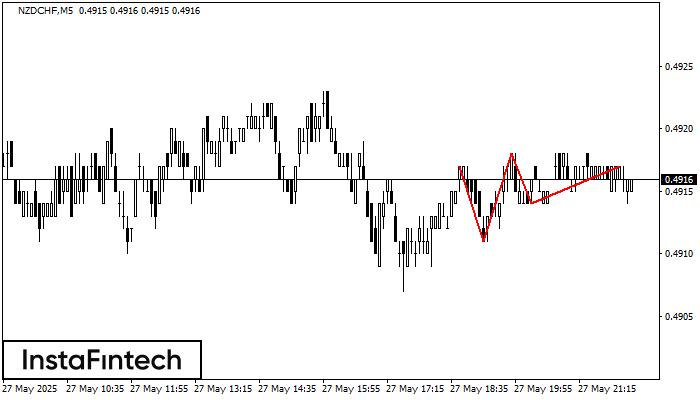
On the chart of the NZDCHF M5 trading instrument, the Triple Top pattern that signals a trend change has formed. It is possible that after formation of the third peak
The M5 and M15 time frames may have more false entry points.
Открыть график инструмента в новом окне


