

รูปแบบกราฟ

รูปแบบกราฟนั้นเป็น รูปจำลองทางกราฟฟิกที่ถูกสร้างขึ้นมาในชาร์ตจากราคา อ้างอิงตามหนึ่งในการวิเคราะห์ทางเทคนิค ที่ตั้งสมมติฐานมาว่า ประวัติศาสตร์ (การเคลื่อนไหวของราคา) มักจะเกิดขึ้นซ้ำรอยเดิม นั้นหมายความว่า การเคลื่อนไหวของราคาก็หมือนกับ สถานการณ์หนึ่งที่จะสามารถทำการคาดการณ์ไปยังทิศทางในอนาคต ตามเหตุการณ์ที่น่าจะมีความเป็นไปได้สูง
รูปแบบกราฟที่สำคัญจากทาง InstaTrade นั้นจะเป็นการบริการที่มีการใช้อย่างง่ายดาย ซึ่งจะช่วยให้คุณสามารถทราบถึงการเปลี่ยนแปลงล่าสุด ในตลาดได้ และสามารถรับมือกับข้อมูลจากทางตลาดได้ทันท่วงที ในการบริการของพวกเรานั้น คุณจะพบกับรูปแบบกราฟล่าสุดและมีความสำคัญมากที่สุดในทุกๆคู่สกุลเงิน และทุกๆขอบเขตเวลา
Bullish Symmetrical Triangle
was formed on 24.04 at 02:02:52 (UTC+0)
signal strength 3 of 5
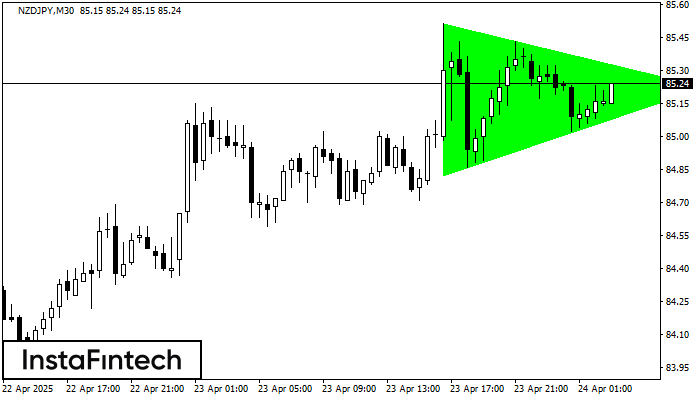
According to the chart of M30, NZDJPY formed the Bullish Symmetrical Triangle pattern, which signals the trend will continue. Description. The upper border of the pattern touches the coordinates 85.51/85.22 whereas the lower border goes across 84.82/85.22. The pattern width is measured on the chart at 69 pips. If the Bullish Symmetrical Triangle pattern is in progress during the upward trend, this indicates the current trend will go on. In case 85.22 is broken, the price could continue its move toward 85.52.
ดูเพิ่มเติม
- All
- All
- Bearish Rectangle
- Bearish Symmetrical Triangle
- Bearish Symmetrical Triangle
- Bullish Rectangle
- Double Top
- Double Top
- Triple Bottom
- Triple Bottom
- Triple Top
- Triple Top
- All
- All
- Buy
- Sale
- All
- 1
- 2
- 3
- 4
- 5
Тройная вершина
сформирован 01.06 в 02:15:04 (UTC+0)
сила сигнала 2 из 5

На графике #Bitcoin M15 образовалась фигура «Тройная вершина». Данная фигура относится к типу разворотных и имеет характеристику: Верхняя граница 104800.13/104799.73; Нижняя граница 104215.56/104423.26; Ширина фигуры 43254 пунктов. Прогноз: В случае
Таймфреймы М5 и М15 могут иметь больше ложных точек входа.
Открыть график инструмента в новом окне
Двойная вершина
сформирован 01.06 в 01:00:35 (UTC+0)
сила сигнала 3 из 5

По #Bitcoin на M30 сформировалась разворотная фигура «Двойная вершина». Характеристика: Верхняя граница 104800.13; Нижняя граница 104215.56; Ширина фигуры 64024 пунктов. Позицию на продажу возможно открыть ниже нижней границы 104215.56
Открыть график инструмента в новом окне
Прямоугольник
сформирован 31.05 в 19:15:46 (UTC+0)
сила сигнала 1 из 5

По торговому инструменту #Bitcoin на M5 сформировалась фигура продолжения тренда - «Прямоугольник». Фигура имеет границы: Нижняя 104335.43; Верхняя 104800.13. В случае пробоя верхней границы вероятно дальнейшее движение в сторону тренда
Таймфреймы М5 и М15 могут иметь больше ложных точек входа.
Открыть график инструмента в новом окне


