

รูปแบบกราฟ

รูปแบบกราฟนั้นเป็น รูปจำลองทางกราฟฟิกที่ถูกสร้างขึ้นมาในชาร์ตจากราคา อ้างอิงตามหนึ่งในการวิเคราะห์ทางเทคนิค ที่ตั้งสมมติฐานมาว่า ประวัติศาสตร์ (การเคลื่อนไหวของราคา) มักจะเกิดขึ้นซ้ำรอยเดิม นั้นหมายความว่า การเคลื่อนไหวของราคาก็หมือนกับ สถานการณ์หนึ่งที่จะสามารถทำการคาดการณ์ไปยังทิศทางในอนาคต ตามเหตุการณ์ที่น่าจะมีความเป็นไปได้สูง
รูปแบบกราฟที่สำคัญจากทาง InstaTrade นั้นจะเป็นการบริการที่มีการใช้อย่างง่ายดาย ซึ่งจะช่วยให้คุณสามารถทราบถึงการเปลี่ยนแปลงล่าสุด ในตลาดได้ และสามารถรับมือกับข้อมูลจากทางตลาดได้ทันท่วงที ในการบริการของพวกเรานั้น คุณจะพบกับรูปแบบกราฟล่าสุดและมีความสำคัญมากที่สุดในทุกๆคู่สกุลเงิน และทุกๆขอบเขตเวลา
Double Bottom
was formed on 15.04 at 21:15:37 (UTC+0)
signal strength 2 of 5
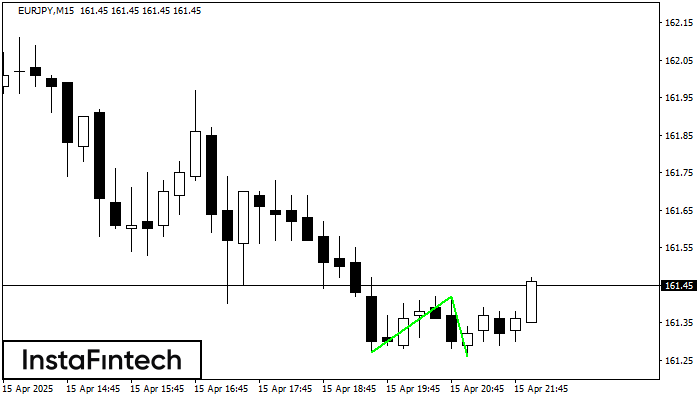
The Double Bottom pattern has been formed on EURJPY M15; the upper boundary is 161.42; the lower boundary is 161.26. The width of the pattern is 15 points. In case of a break of the upper boundary 161.42, a change in the trend can be predicted where the width of the pattern will coincide with the distance to a possible take profit level.
The M5 and M15 time frames may have more false entry points.
ดูเพิ่มเติม
- All
- All
- Bearish Rectangle
- Bearish Symmetrical Triangle
- Bearish Symmetrical Triangle
- Bullish Rectangle
- Double Top
- Double Top
- Triple Bottom
- Triple Bottom
- Triple Top
- Triple Top
- All
- All
- Buy
- Sale
- All
- 1
- 2
- 3
- 4
- 5
รูปแบบกราฟจุดสองยอด (Double Top)
was formed on 06.06 at 05:05:28 (UTC+0)
signal strength 1 of 5
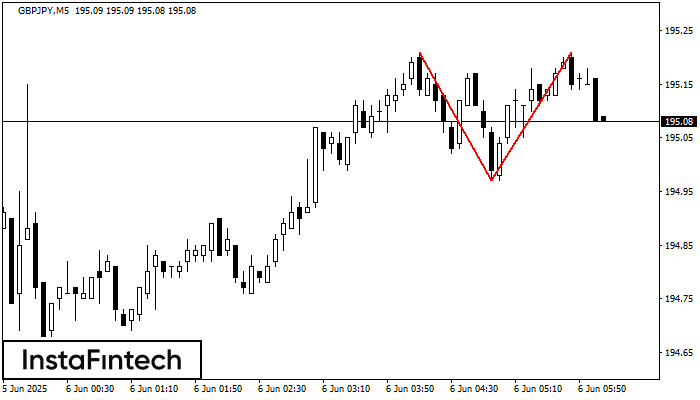
รูปแบบการย้อนตัว รูปแบบกราฟจุดสองยอด (Double Top) ได้ถูกสร้างขึ้นมาใน GBPJPY M5 คุณลักษณะ: ขอบเขตด้านบน 195.21; ขอบเขตด้านล่าง 194.97; ความกว้างของกราฟรูปแบบนี้คือ 24 จุด
ขอบเตระยะเวลาใน M5 และ M15 อาจจะมีตำแหน่งการเข้าใช้งานที่ผิดพลาดมากยิ่งขึ้น
Open chart in a new window
รูปแบบกราฟหัวและหัวไหล่ (Head and Shoulders)
was formed on 06.06 at 05:01:27 (UTC+0)
signal strength 4 of 5
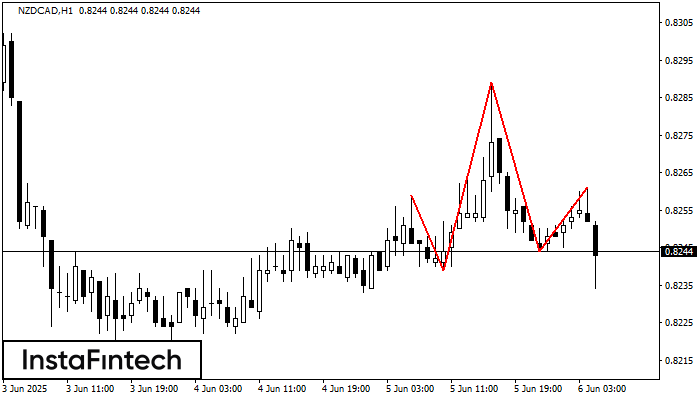
รูปแบบทางเทคนิค ทำให้เกิด รูปแบบกราฟหัวและหัวไหล่ (Head and Shoulders) ที่ปรากฎออกมาในชาร์ตของ NZDCAD H1 มีเหตุผลที่หนักแน่นอยู่หลายประการที่แสดงให้เห็นว่า ราคาจะมุ่งหน้าผ่านตำแหน่งส่วนคอ 0.8239/0.8244 หลังจากตำแหน่งส่วนหัวไหล่ด้านขวาได้ถูกสร้างขึ้นมา ดังนั้นแนวโน้มจะมีการเปลี่ยนแปลงพร้อมกับราคาที่จะมุ่งหน้าไปยัง0.8204
Open chart in a new window
รูปแบบกราฟหัวและหัวไหล่แบบกลับหัว (Inverse Head and Shoulder)
was formed on 06.06 at 05:00:19 (UTC+0)
signal strength 4 of 5
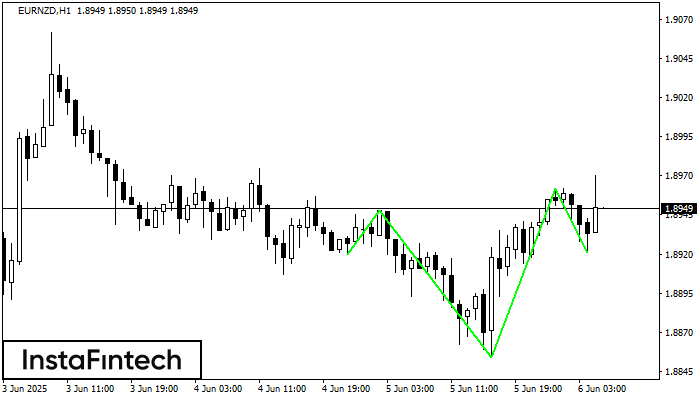
อ้างอิงจาก H1, EURNZD กำลังก่อรูปแบบทางเทคนิคขึ้นมา รูปแบบกราฟหัวและหัวไหล่แบบกลับหัว (Inverse Head and Shoulder) ในกรณีที่มีการเคลื่อนตัวทะลุผ่านตำแหน่งคอ 1.8948/1.8962 ออกไป ตราสารก็อาจจะเคลื่อนตัวไปยัง 1.9002
Open chart in a new window


