

รูปแบบกราฟ

รูปแบบกราฟนั้นเป็น รูปจำลองทางกราฟฟิกที่ถูกสร้างขึ้นมาในชาร์ตจากราคา อ้างอิงตามหนึ่งในการวิเคราะห์ทางเทคนิค ที่ตั้งสมมติฐานมาว่า ประวัติศาสตร์ (การเคลื่อนไหวของราคา) มักจะเกิดขึ้นซ้ำรอยเดิม นั้นหมายความว่า การเคลื่อนไหวของราคาก็หมือนกับ สถานการณ์หนึ่งที่จะสามารถทำการคาดการณ์ไปยังทิศทางในอนาคต ตามเหตุการณ์ที่น่าจะมีความเป็นไปได้สูง
รูปแบบกราฟที่สำคัญจากทาง InstaTrade นั้นจะเป็นการบริการที่มีการใช้อย่างง่ายดาย ซึ่งจะช่วยให้คุณสามารถทราบถึงการเปลี่ยนแปลงล่าสุด ในตลาดได้ และสามารถรับมือกับข้อมูลจากทางตลาดได้ทันท่วงที ในการบริการของพวกเรานั้น คุณจะพบกับรูปแบบกราฟล่าสุดและมีความสำคัญมากที่สุดในทุกๆคู่สกุลเงิน และทุกๆขอบเขตเวลา
Bearish Rectangle
was formed on 15.04 at 12:03:16 (UTC+0)
signal strength 1 of 5
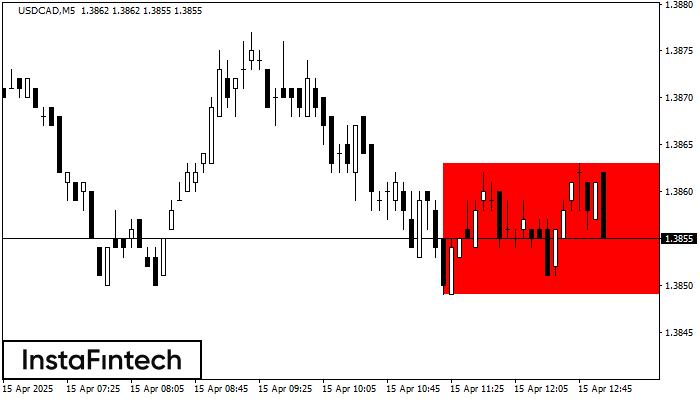
According to the chart of M5, USDCAD formed the Bearish Rectangle. The pattern indicates a trend continuation. The upper border is 1.3863, the lower border is 1.3849. The signal means that a short position should be opened after fixing a price below the lower border 1.3849 of the Bearish Rectangle.
The M5 and M15 time frames may have more false entry points.
ดูเพิ่มเติม
- All
- All
- Bearish Rectangle
- Bearish Symmetrical Triangle
- Bearish Symmetrical Triangle
- Bullish Rectangle
- Double Top
- Double Top
- Triple Bottom
- Triple Bottom
- Triple Top
- Triple Top
- All
- All
- Buy
- Sale
- All
- 1
- 2
- 3
- 4
- 5
Double Top
was formed on 04.06 at 02:30:10 (UTC+0)
signal strength 2 of 5
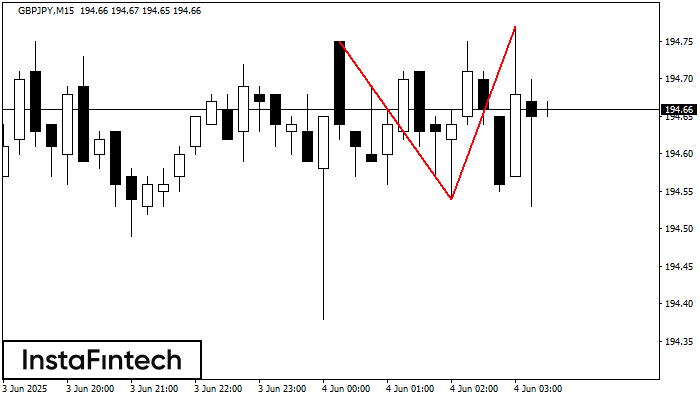
Corak Double Top telah dibentuk pada GBPJPY M15. Isyarat bahawa aliran telah berubah dari aliran menaik ke aliran menurun. Mungkin, sekiranya asas corak 194.54 ditembusi, pergerakan menurun akan berterusan
Carta masa M5 dan M15 mungkin mempunyai lebih banyak titik kemasukan palsu.
Open chart in a new window
Segi Empat Menaik
was formed on 04.06 at 02:29:16 (UTC+0)
signal strength 2 of 5
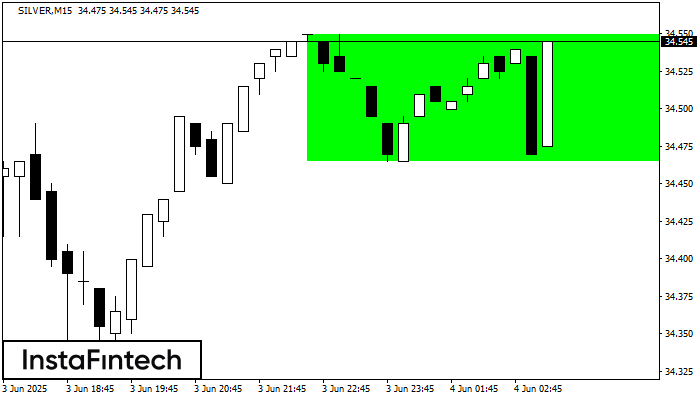
Berdasarkan carta M15, SILVER telah membentuk Segi Empat Menaik. Jenis corak ini menunjukkan kesinambungan aliran. Ia terdiri daripada dua tahap: rintangan 34.55 dan sokongan 34.47. Sekiranya tahap rintangan 34.55
Carta masa M5 dan M15 mungkin mempunyai lebih banyak titik kemasukan palsu.
Open chart in a new window
Double Top
was formed on 04.06 at 02:15:44 (UTC+0)
signal strength 1 of 5
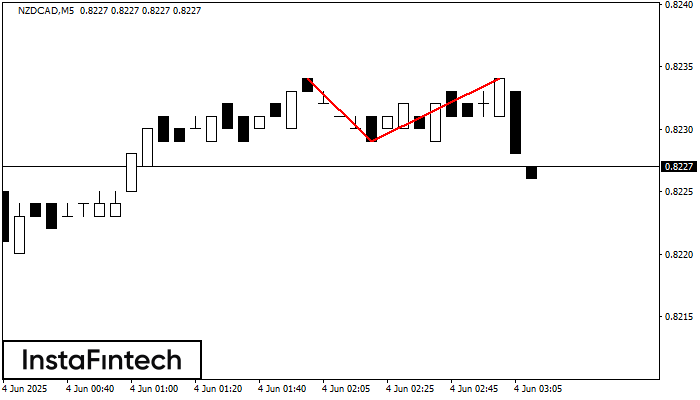
Corak pembalikan Double Top telah dibentuk pada NZDCAD M5. Ciri-ciri: sempadan atas %P0.000000; sempadan bawah 0.8234; sempadan bawah 0.8229; lebar corak adalah 5 mata. Dagangan menjual adalah lebih baik untuk
Carta masa M5 dan M15 mungkin mempunyai lebih banyak titik kemasukan palsu.
Open chart in a new window


