

รูปแบบกราฟ

รูปแบบกราฟนั้นเป็น รูปจำลองทางกราฟฟิกที่ถูกสร้างขึ้นมาในชาร์ตจากราคา อ้างอิงตามหนึ่งในการวิเคราะห์ทางเทคนิค ที่ตั้งสมมติฐานมาว่า ประวัติศาสตร์ (การเคลื่อนไหวของราคา) มักจะเกิดขึ้นซ้ำรอยเดิม นั้นหมายความว่า การเคลื่อนไหวของราคาก็หมือนกับ สถานการณ์หนึ่งที่จะสามารถทำการคาดการณ์ไปยังทิศทางในอนาคต ตามเหตุการณ์ที่น่าจะมีความเป็นไปได้สูง
รูปแบบกราฟที่สำคัญจากทาง InstaTrade นั้นจะเป็นการบริการที่มีการใช้อย่างง่ายดาย ซึ่งจะช่วยให้คุณสามารถทราบถึงการเปลี่ยนแปลงล่าสุด ในตลาดได้ และสามารถรับมือกับข้อมูลจากทางตลาดได้ทันท่วงที ในการบริการของพวกเรานั้น คุณจะพบกับรูปแบบกราฟล่าสุดและมีความสำคัญมากที่สุดในทุกๆคู่สกุลเงิน และทุกๆขอบเขตเวลา
Bullish Flag
was formed on 15.04 at 11:20:46 (UTC+0)
signal strength 1 of 5
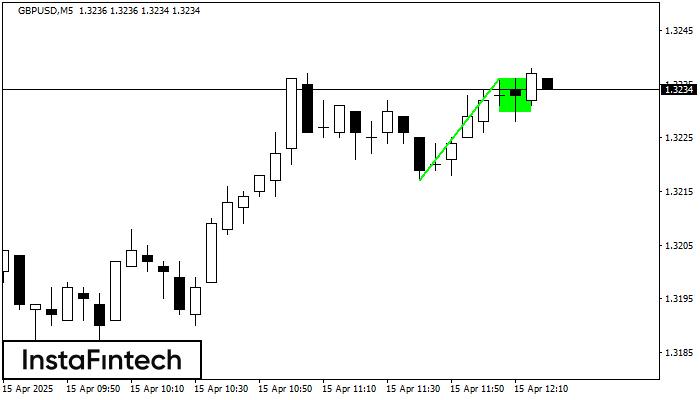
The Bullish Flag pattern which signals continuation of a trend has been formed on the chart GBPUSD M5. Forecast: if the price breaks above the pattern high at 1.3236, then traders will be able to place a long deal with the target at 1.3251.
The M5 and M15 time frames may have more false entry points.
ดูเพิ่มเติม
- All
- All
- Bearish Rectangle
- Bearish Symmetrical Triangle
- Bearish Symmetrical Triangle
- Bullish Rectangle
- Double Top
- Double Top
- Triple Bottom
- Triple Bottom
- Triple Top
- Triple Top
- All
- All
- Buy
- Sale
- All
- 1
- 2
- 3
- 4
- 5
Bearish pennant
was formed on 08.09 at 23:28:04 (UTC+0)
signal strength 1 of 5
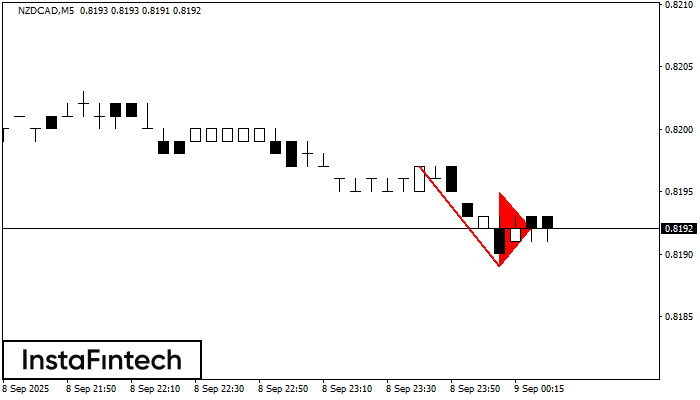
The Bearish pennant pattern has formed on the NZDCAD M5 chart. The pattern signals continuation of the downtrend in case the pennant’s low of 0.8189 is broken through. Recommendations: Place
The M5 and M15 time frames may have more false entry points.
Open chart in a new window
Head and Shoulders
was formed on 08.09 at 23:18:03 (UTC+0)
signal strength 2 of 5
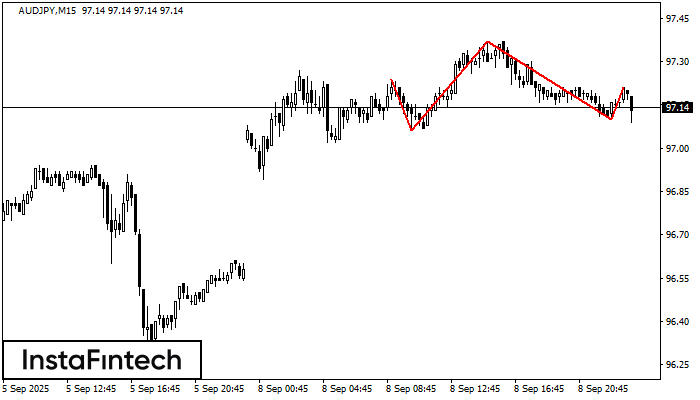
The AUDJPY M15 formed the Head and Shoulders pattern with the following features: The Head’s top is at 97.37, the Neckline and the upward angle are at 97.06/97.10. The formation
The M5 and M15 time frames may have more false entry points.
Open chart in a new window
Double Top
was formed on 08.09 at 23:00:25 (UTC+0)
signal strength 3 of 5
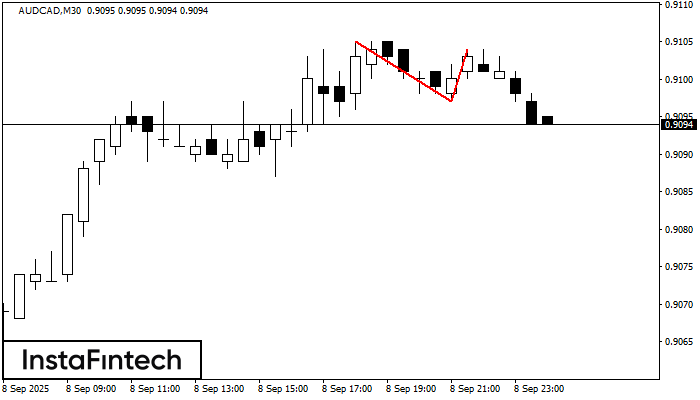
The Double Top reversal pattern has been formed on AUDCAD M30. Characteristics: the upper boundary 0.9105; the lower boundary 0.9097; the width of the pattern is 7 points. Sell trades
Open chart in a new window


