

รูปแบบกราฟ

รูปแบบกราฟนั้นเป็น รูปจำลองทางกราฟฟิกที่ถูกสร้างขึ้นมาในชาร์ตจากราคา อ้างอิงตามหนึ่งในการวิเคราะห์ทางเทคนิค ที่ตั้งสมมติฐานมาว่า ประวัติศาสตร์ (การเคลื่อนไหวของราคา) มักจะเกิดขึ้นซ้ำรอยเดิม นั้นหมายความว่า การเคลื่อนไหวของราคาก็หมือนกับ สถานการณ์หนึ่งที่จะสามารถทำการคาดการณ์ไปยังทิศทางในอนาคต ตามเหตุการณ์ที่น่าจะมีความเป็นไปได้สูง
รูปแบบกราฟที่สำคัญจากทาง InstaTrade นั้นจะเป็นการบริการที่มีการใช้อย่างง่ายดาย ซึ่งจะช่วยให้คุณสามารถทราบถึงการเปลี่ยนแปลงล่าสุด ในตลาดได้ และสามารถรับมือกับข้อมูลจากทางตลาดได้ทันท่วงที ในการบริการของพวกเรานั้น คุณจะพบกับรูปแบบกราฟล่าสุดและมีความสำคัญมากที่สุดในทุกๆคู่สกุลเงิน และทุกๆขอบเขตเวลา
Double Top
was formed on 14.04 at 11:20:29 (UTC+0)
signal strength 1 of 5
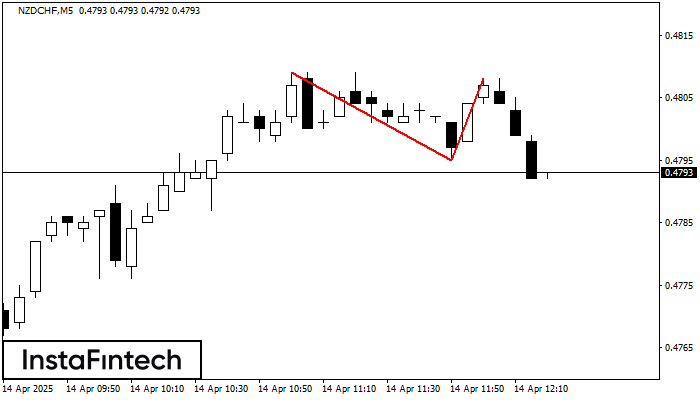
The Double Top reversal pattern has been formed on NZDCHF M5. Characteristics: the upper boundary 0.4809; the lower boundary 0.4795; the width of the pattern is 13 points. Sell trades are better to be opened below the lower boundary 0.4795 with a possible movements towards the 0.4780 level.
The M5 and M15 time frames may have more false entry points.
- All
- All
- Bearish Rectangle
- Bearish Symmetrical Triangle
- Bearish Symmetrical Triangle
- Bullish Rectangle
- Double Top
- Double Top
- Triple Bottom
- Triple Bottom
- Triple Top
- Triple Top
- All
- All
- Buy
- Sale
- All
- 1
- 2
- 3
- 4
- 5
Медвежий вымпел
сформирован 02.06 в 14:45:11 (UTC+0)
сила сигнала 4 из 5
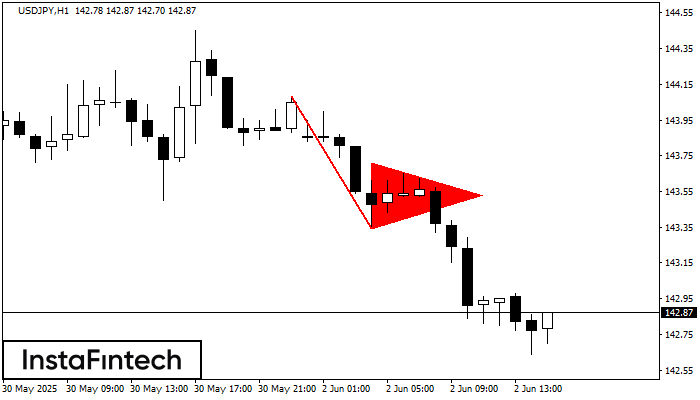
На графике USDJPY H1 сформировалась фигура «Медвежий вымпел», которая сигнализирует о возможном продолжении тренда. Характеристика: основание фигуры имеет координаты 143.34; проекция высоты флагштока равна 74 пунктов. В случае если цена
Открыть график инструмента в новом окне
Прямоугольник
сформирован 02.06 в 14:35:19 (UTC+0)
сила сигнала 2 из 5
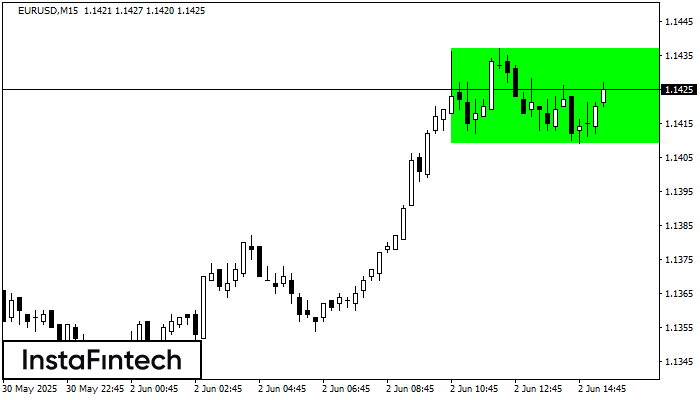
По торговому инструменту EURUSD на M15 сформировалась фигура продолжения тренда - «Прямоугольник». Фигура имеет границы: Нижняя 1.1409; Верхняя 1.1437. В случае пробоя верхней границы вероятно дальнейшее движение в сторону тренда
Таймфреймы М5 и М15 могут иметь больше ложных точек входа.
Открыть график инструмента в новом окне
Прямоугольник
сформирован 02.06 в 13:16:37 (UTC+0)
сила сигнала 1 из 5
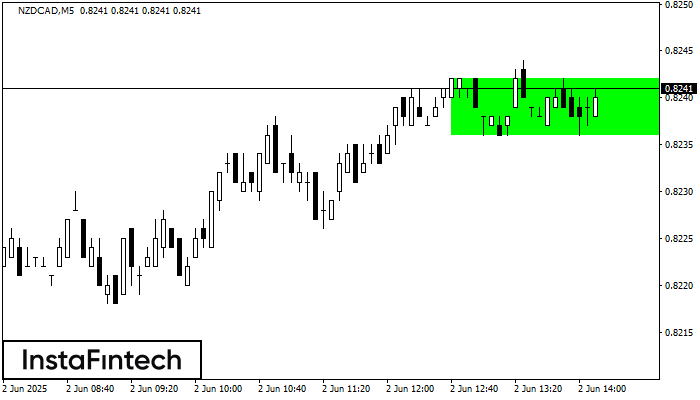
Сформирована фигура «Прямоугольник» на графике NZDCAD M5. Тип фигуры: Продолжение тренда; Границы: Верхняя 0.8242, Нижняя 0.8236; Сигнал: позицию на покупку следует открывать выше верхней границы прямоугольника 0.8242
Таймфреймы М5 и М15 могут иметь больше ложных точек входа.
Открыть график инструмента в новом окне


