

รูปแบบกราฟ

รูปแบบกราฟนั้นเป็น รูปจำลองทางกราฟฟิกที่ถูกสร้างขึ้นมาในชาร์ตจากราคา อ้างอิงตามหนึ่งในการวิเคราะห์ทางเทคนิค ที่ตั้งสมมติฐานมาว่า ประวัติศาสตร์ (การเคลื่อนไหวของราคา) มักจะเกิดขึ้นซ้ำรอยเดิม นั้นหมายความว่า การเคลื่อนไหวของราคาก็หมือนกับ สถานการณ์หนึ่งที่จะสามารถทำการคาดการณ์ไปยังทิศทางในอนาคต ตามเหตุการณ์ที่น่าจะมีความเป็นไปได้สูง
รูปแบบกราฟที่สำคัญจากทาง InstaTrade นั้นจะเป็นการบริการที่มีการใช้อย่างง่ายดาย ซึ่งจะช่วยให้คุณสามารถทราบถึงการเปลี่ยนแปลงล่าสุด ในตลาดได้ และสามารถรับมือกับข้อมูลจากทางตลาดได้ทันท่วงที ในการบริการของพวกเรานั้น คุณจะพบกับรูปแบบกราฟล่าสุดและมีความสำคัญมากที่สุดในทุกๆคู่สกุลเงิน และทุกๆขอบเขตเวลา
Triple Bottom
was formed on 14.04 at 01:00:54 (UTC+0)
signal strength 4 of 5

The Triple Bottom pattern has been formed on USDCHF H1. It has the following characteristics: resistance level 0.8256/0.8192; support level 0.8140/0.8142; the width is 116 points. In the event of a breakdown of the resistance level of 0.8256, the price is likely to continue an upward movement at least to 0.8138.
ดูเพิ่มเติม
- All
- All
- Bearish Rectangle
- Bearish Symmetrical Triangle
- Bearish Symmetrical Triangle
- Bullish Rectangle
- Double Top
- Double Top
- Triple Bottom
- Triple Bottom
- Triple Top
- Triple Top
- All
- All
- Buy
- Sale
- All
- 1
- 2
- 3
- 4
- 5
Double Bottom
was formed on 26.11 at 11:00:18 (UTC+0)
signal strength 4 of 5
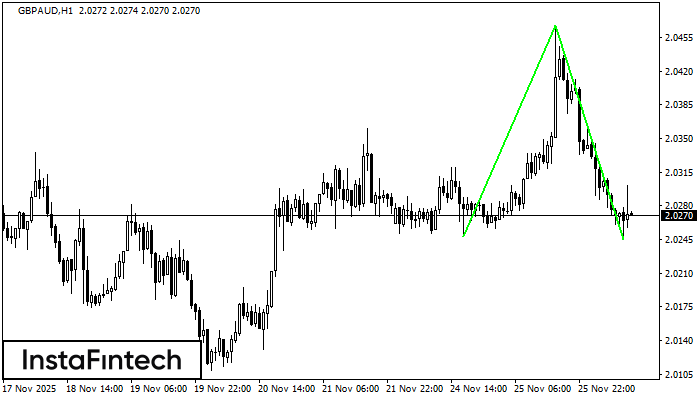
The Double Bottom pattern has been formed on GBPAUD H1; the upper boundary is 2.0468; the lower boundary is 2.0245. The width of the pattern is 220 points. In case
Open chart in a new window
Double Bottom
was formed on 26.11 at 10:30:23 (UTC+0)
signal strength 3 of 5
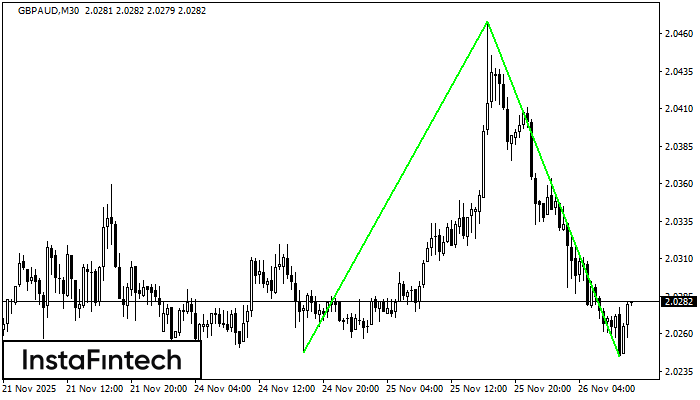
The Double Bottom pattern has been formed on GBPAUD M30. Characteristics: the support level 2.0248; the resistance level 2.0468; the width of the pattern 220 points. If the resistance level
Open chart in a new window
Double Bottom
was formed on 26.11 at 10:15:25 (UTC+0)
signal strength 2 of 5
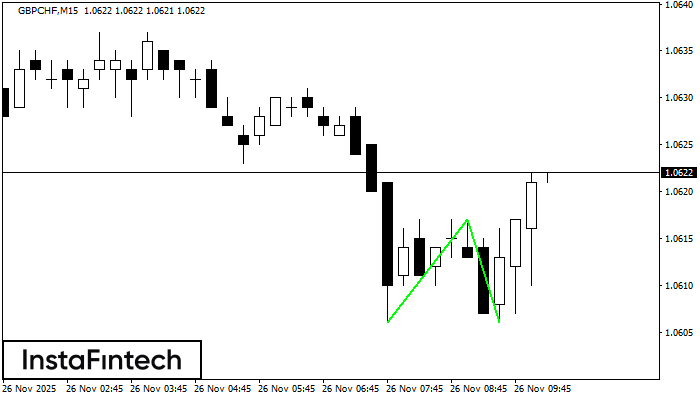
The Double Bottom pattern has been formed on GBPCHF M15; the upper boundary is 1.0617; the lower boundary is 1.0606. The width of the pattern is 11 points. In case
The M5 and M15 time frames may have more false entry points.
Open chart in a new window


