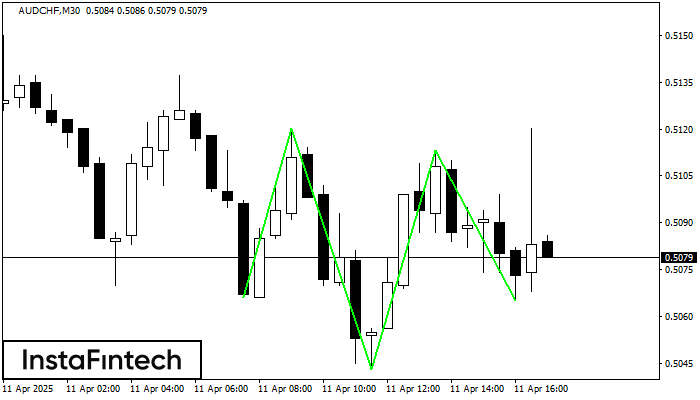
Inverse Head and Shoulder
was formed on 11.04 at 15:59:57 (UTC+0)
signal strength 3 of 5

According to the chart of M30, AUDCHF produced the pattern termed the Inverse Head and Shoulder. The Head is fixed at 0.5043 while the median line of the Neck is set at 0.5120/0.5113. The formation of the Inverse Head and Shoulder Pattern clearly indicates a reversal of the downward trend. In means that in case the scenario comes true, the price of AUDCHF will go towards 0.5143.
ดูเพิ่มเติม
- All
- All
- Bearish Rectangle
- Bearish Symmetrical Triangle
- Bearish Symmetrical Triangle
- Bullish Rectangle
- Double Top
- Double Top
- Triple Bottom
- Triple Bottom
- Triple Top
- Triple Top
- All
- All
- Buy
- Sale
- All
- 1
- 2
- 3
- 4
- 5
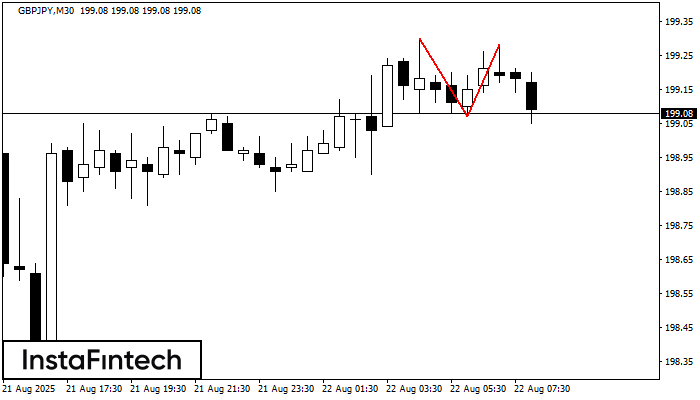
รูปแบบกราฟจุดสองยอด (Double Top)
was formed on 22.08 at 07:30:33 (UTC+0)
signal strength 3 of 5
รูปแบบการย้อนตัว รูปแบบกราฟจุดสองยอด (Double Top) ได้ถูกสร้างขึ้นมาใน GBPJPY M30 คุณลักษณะ: ขอบเขตด้านบน 199.30; ขอบเขตด้านล่าง 199.07; ความกว้างของกราฟรูปแบบนี้คือ 21 จุด
Open chart in a new window
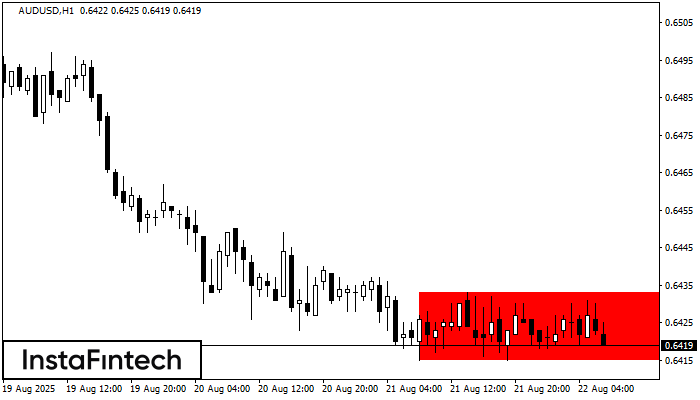
รูปแบบกราฟสี่เหลี่ยมผืนผ้าขาลง (Bearish Rectangle)
was formed on 22.08 at 06:30:53 (UTC+0)
signal strength 4 of 5
อ้างอิงจากชาร์ตของ H1, AUDUSD ที่ได้สร้างรูปแบบ รูปแบบกราฟสี่เหลี่ยมผืนผ้าขาลง (Bearish Rectangle) ออกมา รูปแบบนี้แสดงถึง ความต่อเนื่องในแนวโน้ม ขอบเขตด้านบนคือ 0.6433 ส่วนขอบเขตด้านล่างคือ 0.6415 สัญญาณนี้แสดงถึง
Open chart in a new window
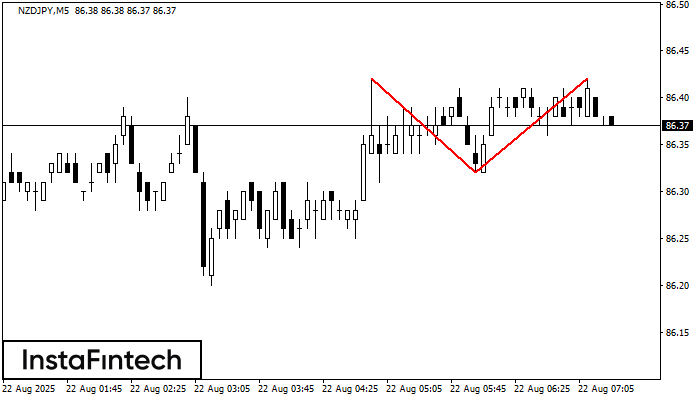
รูปแบบกราฟจุดสองยอด (Double Top)
was formed on 22.08 at 06:25:28 (UTC+0)
signal strength 1 of 5
รูปแบบการย้อนตัว รูปแบบกราฟจุดสองยอด (Double Top) ได้ถูกสร้างขึ้นมาใน NZDJPY M5 คุณลักษณะ: ขอบเขตด้านบน 86.42; ขอบเขตด้านล่าง 86.32; ความกว้างของกราฟรูปแบบนี้คือ 10 จุด
ขอบเตระยะเวลาใน M5 และ M15 อาจจะมีตำแหน่งการเข้าใช้งานที่ผิดพลาดมากยิ่งขึ้น
Open chart in a new window


