

รูปแบบกราฟ

รูปแบบกราฟนั้นเป็น รูปจำลองทางกราฟฟิกที่ถูกสร้างขึ้นมาในชาร์ตจากราคา อ้างอิงตามหนึ่งในการวิเคราะห์ทางเทคนิค ที่ตั้งสมมติฐานมาว่า ประวัติศาสตร์ (การเคลื่อนไหวของราคา) มักจะเกิดขึ้นซ้ำรอยเดิม นั้นหมายความว่า การเคลื่อนไหวของราคาก็หมือนกับ สถานการณ์หนึ่งที่จะสามารถทำการคาดการณ์ไปยังทิศทางในอนาคต ตามเหตุการณ์ที่น่าจะมีความเป็นไปได้สูง
รูปแบบกราฟที่สำคัญจากทาง InstaTrade นั้นจะเป็นการบริการที่มีการใช้อย่างง่ายดาย ซึ่งจะช่วยให้คุณสามารถทราบถึงการเปลี่ยนแปลงล่าสุด ในตลาดได้ และสามารถรับมือกับข้อมูลจากทางตลาดได้ทันท่วงที ในการบริการของพวกเรานั้น คุณจะพบกับรูปแบบกราฟล่าสุดและมีความสำคัญมากที่สุดในทุกๆคู่สกุลเงิน และทุกๆขอบเขตเวลา
Double Top
was formed on 09.04 at 21:50:18 (UTC+0)
signal strength 1 of 5
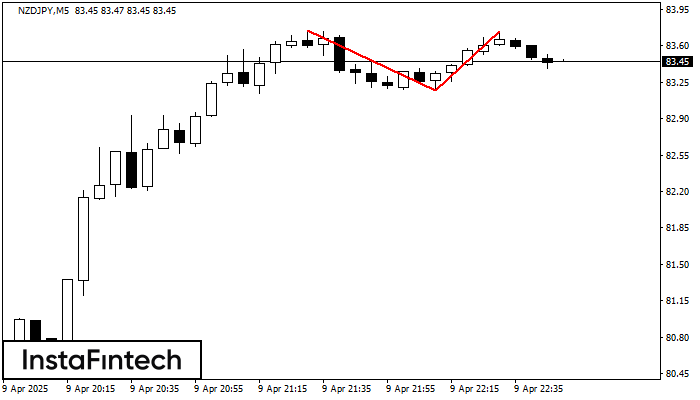
The Double Top reversal pattern has been formed on NZDJPY M5. Characteristics: the upper boundary 83.75; the lower boundary 83.17; the width of the pattern is 57 points. Sell trades are better to be opened below the lower boundary 83.17 with a possible movements towards the 83.02 level.
The M5 and M15 time frames may have more false entry points.
- All
- All
- Bearish Rectangle
- Bearish Symmetrical Triangle
- Bearish Symmetrical Triangle
- Bullish Rectangle
- Double Top
- Double Top
- Triple Bottom
- Triple Bottom
- Triple Top
- Triple Top
- All
- All
- Buy
- Sale
- All
- 1
- 2
- 3
- 4
- 5
Triple Bottom
was formed on 30.05 at 11:36:39 (UTC+0)
signal strength 1 of 5
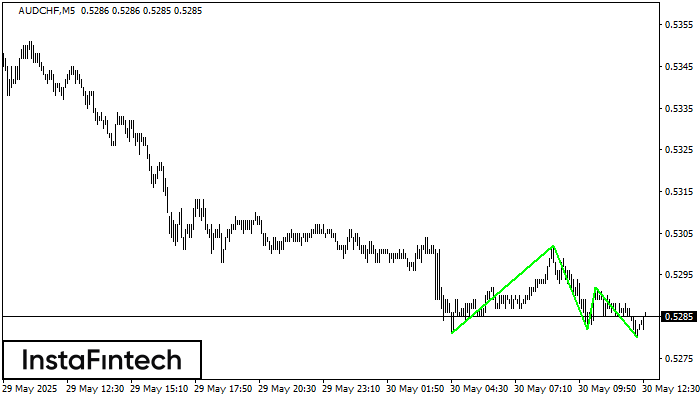
The Triple Bottom pattern has formed on the chart of AUDCHF M5. Features of the pattern: The lower line of the pattern has coordinates 0.5302 with the upper limit 0.5302/0.5292
The M5 and M15 time frames may have more false entry points.
Open chart in a new window
Triple Top
was formed on 30.05 at 10:55:16 (UTC+0)
signal strength 1 of 5
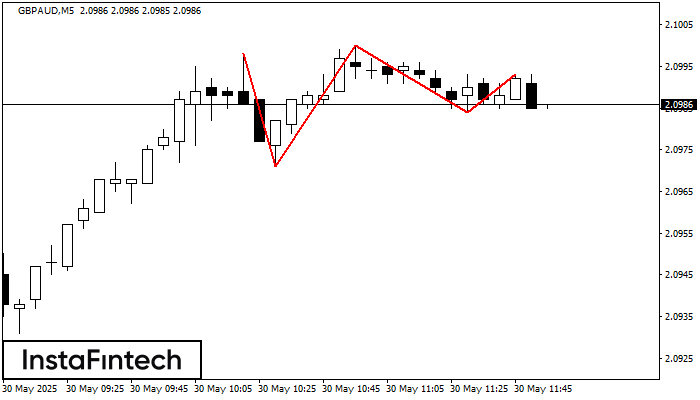
On the chart of the GBPAUD M5 trading instrument, the Triple Top pattern that signals a trend change has formed. It is possible that after formation of the third peak
The M5 and M15 time frames may have more false entry points.
Open chart in a new window
Bearish Rectangle
was formed on 30.05 at 10:51:48 (UTC+0)
signal strength 2 of 5
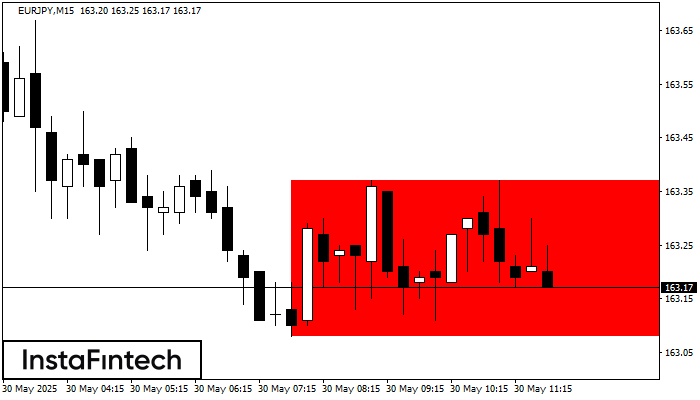
According to the chart of M15, EURJPY formed the Bearish Rectangle which is a pattern of a trend continuation. The pattern is contained within the following borders: lower border 163.08
The M5 and M15 time frames may have more false entry points.
Open chart in a new window


