

รูปแบบกราฟ

รูปแบบกราฟนั้นเป็น รูปจำลองทางกราฟฟิกที่ถูกสร้างขึ้นมาในชาร์ตจากราคา อ้างอิงตามหนึ่งในการวิเคราะห์ทางเทคนิค ที่ตั้งสมมติฐานมาว่า ประวัติศาสตร์ (การเคลื่อนไหวของราคา) มักจะเกิดขึ้นซ้ำรอยเดิม นั้นหมายความว่า การเคลื่อนไหวของราคาก็หมือนกับ สถานการณ์หนึ่งที่จะสามารถทำการคาดการณ์ไปยังทิศทางในอนาคต ตามเหตุการณ์ที่น่าจะมีความเป็นไปได้สูง
รูปแบบกราฟที่สำคัญจากทาง InstaTrade นั้นจะเป็นการบริการที่มีการใช้อย่างง่ายดาย ซึ่งจะช่วยให้คุณสามารถทราบถึงการเปลี่ยนแปลงล่าสุด ในตลาดได้ และสามารถรับมือกับข้อมูลจากทางตลาดได้ทันท่วงที ในการบริการของพวกเรานั้น คุณจะพบกับรูปแบบกราฟล่าสุดและมีความสำคัญมากที่สุดในทุกๆคู่สกุลเงิน และทุกๆขอบเขตเวลา
Bearish Flag
was formed on 08.04 at 18:17:39 (UTC+0)
signal strength 1 of 5

The Bearish Flag pattern has been formed on the chart GOLD M5. Therefore, the downwards trend is likely to continue in the nearest term. As soon as the price breaks below the low at 2993.55, traders should enter the market.
The M5 and M15 time frames may have more false entry points.
- All
- All
- Bearish Rectangle
- Bearish Symmetrical Triangle
- Bearish Symmetrical Triangle
- Bullish Rectangle
- Double Top
- Double Top
- Triple Bottom
- Triple Bottom
- Triple Top
- Triple Top
- All
- All
- Buy
- Sale
- All
- 1
- 2
- 3
- 4
- 5
বিয়ারিশ রেক্ট্যাঙ্গেল
was formed on 30.05 at 13:12:54 (UTC+0)
signal strength 1 of 5
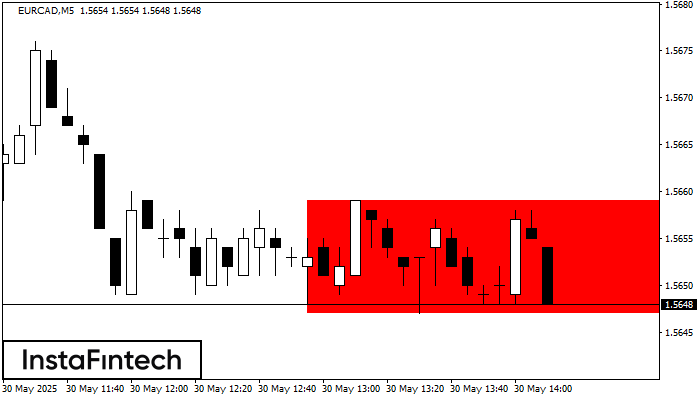
M5 চার্ট অনুযায়ী, EURCAD বিয়ারিশ রেক্ট্যাঙ্গেল গঠন করেছে। এই প্যাটার্ন চলমান প্রবণতার ধারাবাহিকতা নির্দেশ করে। উপরের সীমানা হল 1.5659, নীচের সীমানা হল 1.5647৷ এই সংকেতের অর্থ হল বিয়ারিশ রেক্ট্যাঙ্গেল-এর নীচের
M5 এবং M15 টাইম ফ্রেমে আরও ভুল এন্ট্রি পয়েন্ট থাকতে পারে।
Open chart in a new window
ডাবল বটম
was formed on 30.05 at 12:31:28 (UTC+0)
signal strength 3 of 5
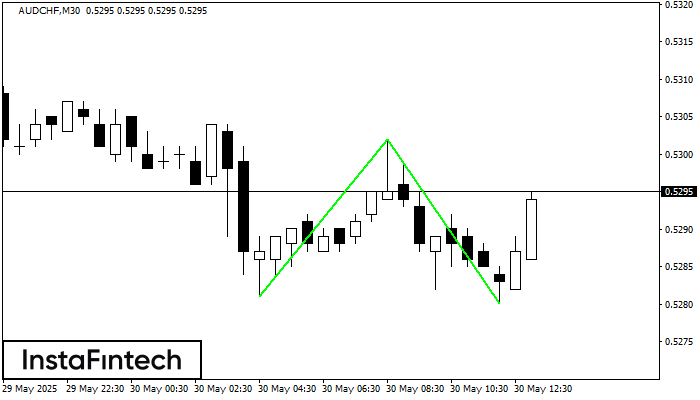
M30 চার্টে, AUDCHF-এর ডাবল বটম প্যাটার্নটি গঠিত হয়েছে। বৈশিষ্ট্য: সাপোর্ট স্তর হচ্ছে 0.5281; রেজিস্ট্যান্স স্তর হচ্ছে 0.5302; প্যাটার্নের প্রস্থ হচ্ছে 21 পয়েন্ট। রেজিস্ট্যান্স স্তর ভেদ করা হলে, 22 পয়েন্টের দূরত্বে
Open chart in a new window
ডাবল বটম
was formed on 30.05 at 12:00:29 (UTC+0)
signal strength 2 of 5
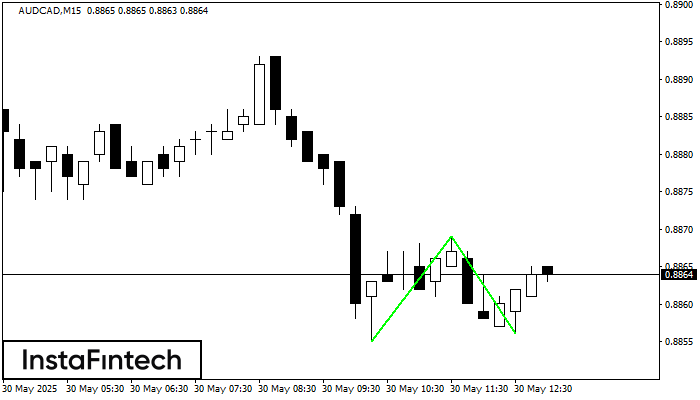
M15 চার্টে, AUDCAD-এর ডাবল বটম প্যাটার্নটি গঠিত হয়েছে। উপরের সীমানা হল 0.8869; নীচের সীমানা হল 0.8856। প্যাটার্নের প্রস্থ হল 14 পয়েন্ট। 0.8869-এর উপরের সীমানা ভেদ করার ক্ষেত্রে, প্রবণতা পরিবর্তনের পূর্বাভাস
M5 এবং M15 টাইম ফ্রেমে আরও ভুল এন্ট্রি পয়েন্ট থাকতে পারে।
Open chart in a new window


