

รูปแบบกราฟ

รูปแบบกราฟนั้นเป็น รูปจำลองทางกราฟฟิกที่ถูกสร้างขึ้นมาในชาร์ตจากราคา อ้างอิงตามหนึ่งในการวิเคราะห์ทางเทคนิค ที่ตั้งสมมติฐานมาว่า ประวัติศาสตร์ (การเคลื่อนไหวของราคา) มักจะเกิดขึ้นซ้ำรอยเดิม นั้นหมายความว่า การเคลื่อนไหวของราคาก็หมือนกับ สถานการณ์หนึ่งที่จะสามารถทำการคาดการณ์ไปยังทิศทางในอนาคต ตามเหตุการณ์ที่น่าจะมีความเป็นไปได้สูง
รูปแบบกราฟที่สำคัญจากทาง InstaTrade นั้นจะเป็นการบริการที่มีการใช้อย่างง่ายดาย ซึ่งจะช่วยให้คุณสามารถทราบถึงการเปลี่ยนแปลงล่าสุด ในตลาดได้ และสามารถรับมือกับข้อมูลจากทางตลาดได้ทันท่วงที ในการบริการของพวกเรานั้น คุณจะพบกับรูปแบบกราฟล่าสุดและมีความสำคัญมากที่สุดในทุกๆคู่สกุลเงิน และทุกๆขอบเขตเวลา
Bearish pennant
was formed on 08.04 at 12:50:05 (UTC+0)
signal strength 2 of 5
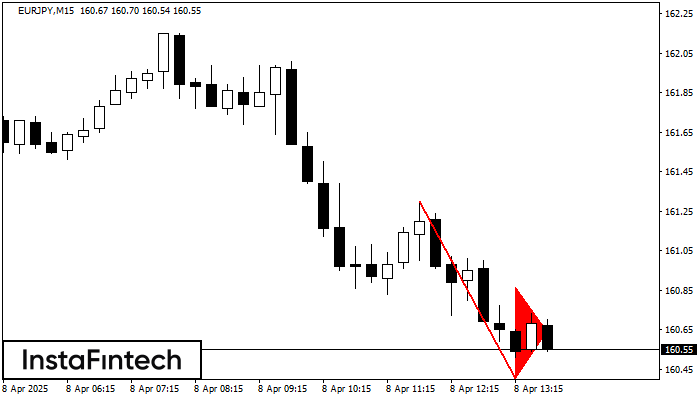
The Bearish pennant pattern has formed on the EURJPY M15 chart. It signals potential continuation of the existing trend. Specifications: the pattern’s bottom has the coordinate of 160.40; the projection of the flagpole height is equal to 90 pips. In case the price breaks out the pattern’s bottom of 160.40, the downtrend is expected to continue for further level 160.18.
The M5 and M15 time frames may have more false entry points.
ดูเพิ่มเติม
- All
- All
- Bearish Rectangle
- Bearish Symmetrical Triangle
- Bearish Symmetrical Triangle
- Bullish Rectangle
- Double Top
- Double Top
- Triple Bottom
- Triple Bottom
- Triple Top
- Triple Top
- All
- All
- Buy
- Sale
- All
- 1
- 2
- 3
- 4
- 5
รูปแบบสามเหลี่ยมสมมาตรขาลง (Bearish Symmetrical Triangle)
was formed on 05.06 at 21:16:00 (UTC+0)
signal strength 1 of 5

อ้างอิงจากชาร์ตของ M5, #NTDOY ที่ได้สร้างรูปแบบ รูปแบบสามเหลี่ยมสมมาตรขาลง (Bearish Symmetrical Triangle) ออกมา คำอธิบาย: ขอบเขตด้านล่างคือ 20.47/20.60 และขอบเขตด้านบนคือ 20.74/20.60 ความกว้างของรูปแบบจะวัดจากชาร์ตใน
ขอบเตระยะเวลาใน M5 และ M15 อาจจะมีตำแหน่งการเข้าใช้งานที่ผิดพลาดมากยิ่งขึ้น
Open chart in a new window
รูปแบบสามเหลี่ยมสมมาตรขาลง (Bearish Symmetrical Triangle)
was formed on 05.06 at 21:15:52 (UTC+0)
signal strength 1 of 5
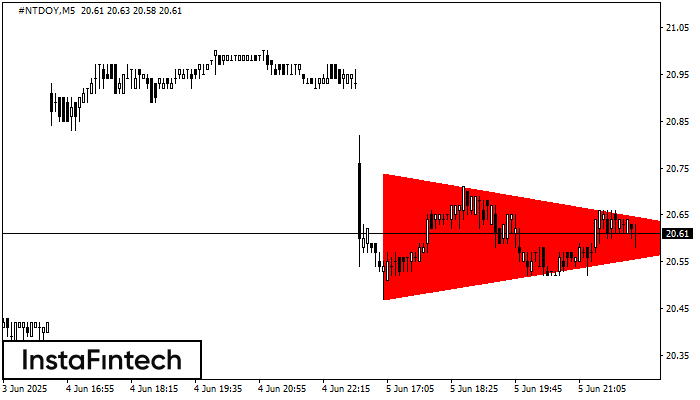
อ้างอิงจากชาร์ตของ M5, #NTDOY ที่ได้สร้างรูปแบบ รูปแบบสามเหลี่ยมสมมาตรขาลง (Bearish Symmetrical Triangle) ออกมา สำหรับคำแนะนำการซื้อขาย คือ การเคลื่อนตัวทะลุผ่านขอบเขตในด้านล่าง 20.47 อาจจะช่วยสนับสนุนต่อแนวโน้มขาลงอย่างต่อเนื่อง
ขอบเตระยะเวลาใน M5 และ M15 อาจจะมีตำแหน่งการเข้าใช้งานที่ผิดพลาดมากยิ่งขึ้น
Open chart in a new window
รูปแบบกราฟจุดสามยอด (Triple Top)
was formed on 05.06 at 21:15:12 (UTC+0)
signal strength 1 of 5
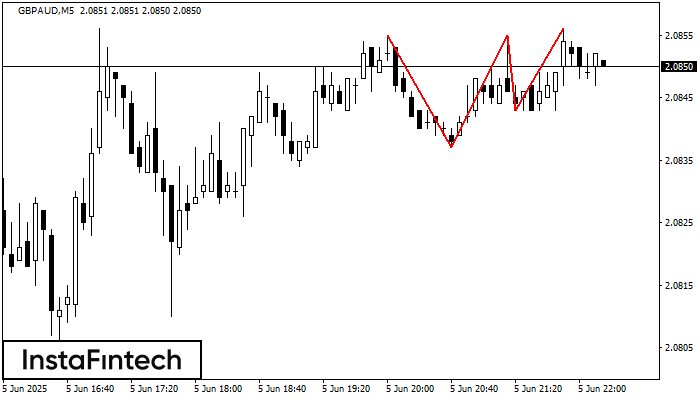
ในชาร์ตของตราสารการซื้อขาย GBPAUD M5 กราฟรูปแบบ รูปแบบกราฟจุดสามยอด (Triple Top) ที่แสดงให้เห็นถึง การเปลี่ยนแปลงของแนวโน้มที่ถูกสร้างขึ้นมา มันเป็นไปได้ที่ หลังจากการก่อตัวของระดับสูงสุดอันดับสามมาแล้ว ราคาจะพยายามเคลื่อนตัวทะลุผ่านระดับของแนวต้าน 2.0837 ที่พวกเราแนะนำให้เปิดสถานะการเทรดไว้เพื่อเป็นการขาย ตำแหน่งการทำกำไรเป็นระยะทางของความกว้างในกราฟรูปแบบนี้
ขอบเตระยะเวลาใน M5 และ M15 อาจจะมีตำแหน่งการเข้าใช้งานที่ผิดพลาดมากยิ่งขึ้น
Open chart in a new window


