

รูปแบบกราฟ

รูปแบบกราฟนั้นเป็น รูปจำลองทางกราฟฟิกที่ถูกสร้างขึ้นมาในชาร์ตจากราคา อ้างอิงตามหนึ่งในการวิเคราะห์ทางเทคนิค ที่ตั้งสมมติฐานมาว่า ประวัติศาสตร์ (การเคลื่อนไหวของราคา) มักจะเกิดขึ้นซ้ำรอยเดิม นั้นหมายความว่า การเคลื่อนไหวของราคาก็หมือนกับ สถานการณ์หนึ่งที่จะสามารถทำการคาดการณ์ไปยังทิศทางในอนาคต ตามเหตุการณ์ที่น่าจะมีความเป็นไปได้สูง
รูปแบบกราฟที่สำคัญจากทาง InstaTrade นั้นจะเป็นการบริการที่มีการใช้อย่างง่ายดาย ซึ่งจะช่วยให้คุณสามารถทราบถึงการเปลี่ยนแปลงล่าสุด ในตลาดได้ และสามารถรับมือกับข้อมูลจากทางตลาดได้ทันท่วงที ในการบริการของพวกเรานั้น คุณจะพบกับรูปแบบกราฟล่าสุดและมีความสำคัญมากที่สุดในทุกๆคู่สกุลเงิน และทุกๆขอบเขตเวลา
Bearish Symmetrical Triangle
was formed on 08.04 at 00:49:24 (UTC+0)
signal strength 1 of 5
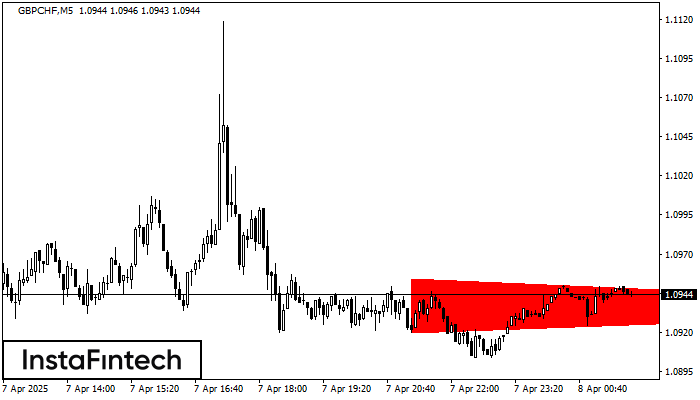
According to the chart of M5, GBPCHF formed the Bearish Symmetrical Triangle pattern. Trading recommendations: A breach of the lower border 1.0920 is likely to encourage a continuation of the downward trend.
The M5 and M15 time frames may have more false entry points.
- All
- All
- Bearish Rectangle
- Bearish Symmetrical Triangle
- Bearish Symmetrical Triangle
- Bullish Rectangle
- Double Top
- Double Top
- Triple Bottom
- Triple Bottom
- Triple Top
- Triple Top
- All
- All
- Buy
- Sale
- All
- 1
- 2
- 3
- 4
- 5
Double Top
was formed on 05.06 at 14:30:23 (UTC+0)
signal strength 2 of 5
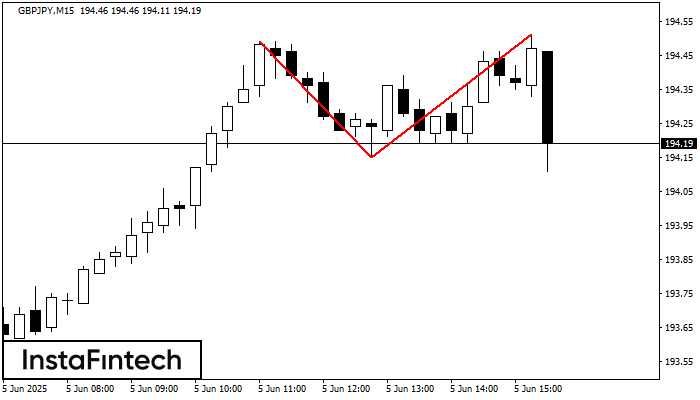
The Double Top reversal pattern has been formed on GBPJPY M15. Characteristics: the upper boundary 194.49; the lower boundary 194.15; the width of the pattern is 36 points. Sell trades
The M5 and M15 time frames may have more false entry points.
Open chart in a new window
Bullish Symmetrical Triangle
was formed on 05.06 at 14:16:35 (UTC+0)
signal strength 1 of 5
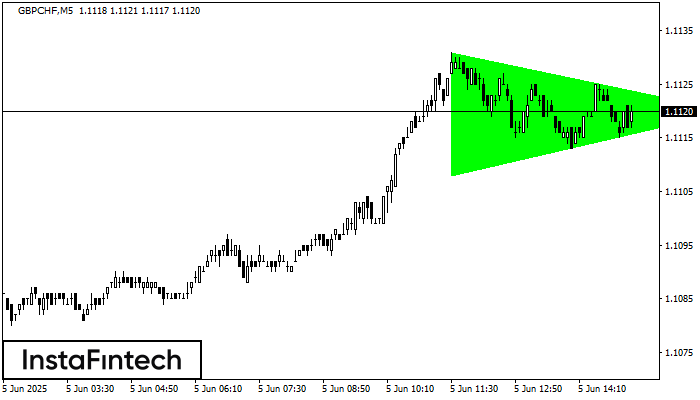
According to the chart of M5, GBPCHF formed the Bullish Symmetrical Triangle pattern. The lower border of the pattern touches the coordinates 1.1108/1.1120 whereas the upper border goes across 1.1131/1.1120
The M5 and M15 time frames may have more false entry points.
Open chart in a new window
Bullish Symmetrical Triangle
was formed on 05.06 at 14:11:00 (UTC+0)
signal strength 1 of 5
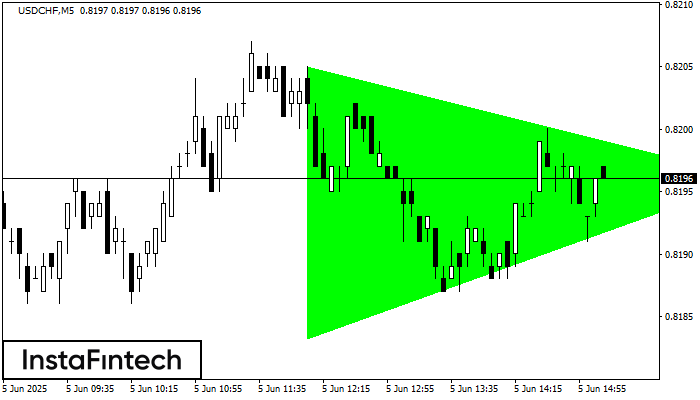
According to the chart of M5, USDCHF formed the Bullish Symmetrical Triangle pattern. The lower border of the pattern touches the coordinates 0.8183/0.8196 whereas the upper border goes across 0.8205/0.8196
The M5 and M15 time frames may have more false entry points.
Open chart in a new window


