

รูปแบบกราฟ

รูปแบบกราฟนั้นเป็น รูปจำลองทางกราฟฟิกที่ถูกสร้างขึ้นมาในชาร์ตจากราคา อ้างอิงตามหนึ่งในการวิเคราะห์ทางเทคนิค ที่ตั้งสมมติฐานมาว่า ประวัติศาสตร์ (การเคลื่อนไหวของราคา) มักจะเกิดขึ้นซ้ำรอยเดิม นั้นหมายความว่า การเคลื่อนไหวของราคาก็หมือนกับ สถานการณ์หนึ่งที่จะสามารถทำการคาดการณ์ไปยังทิศทางในอนาคต ตามเหตุการณ์ที่น่าจะมีความเป็นไปได้สูง
รูปแบบกราฟที่สำคัญจากทาง InstaTrade นั้นจะเป็นการบริการที่มีการใช้อย่างง่ายดาย ซึ่งจะช่วยให้คุณสามารถทราบถึงการเปลี่ยนแปลงล่าสุด ในตลาดได้ และสามารถรับมือกับข้อมูลจากทางตลาดได้ทันท่วงที ในการบริการของพวกเรานั้น คุณจะพบกับรูปแบบกราฟล่าสุดและมีความสำคัญมากที่สุดในทุกๆคู่สกุลเงิน และทุกๆขอบเขตเวลา
Triple Top
was formed on 07.04 at 05:40:17 (UTC+0)
signal strength 1 of 5
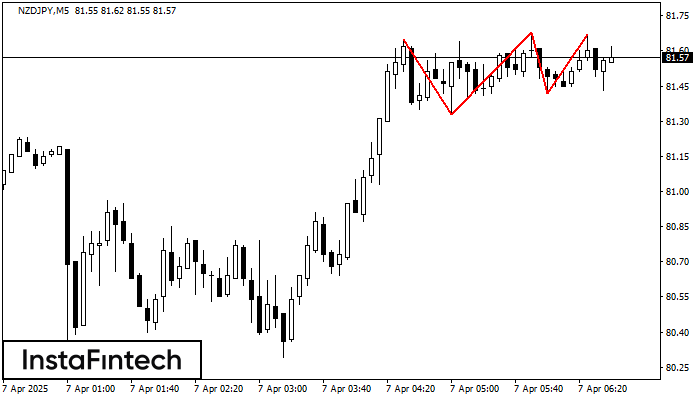
On the chart of the NZDJPY M5 trading instrument, the Triple Top pattern that signals a trend change has formed. It is possible that after formation of the third peak, the price will try to break through the resistance level 81.33, where we advise to open a trading position for sale. Take profit is the projection of the pattern’s width, which is 32 points.
The M5 and M15 time frames may have more false entry points.
ดูเพิ่มเติม
- All
- All
- Bearish Rectangle
- Bearish Symmetrical Triangle
- Bearish Symmetrical Triangle
- Bullish Rectangle
- Double Top
- Double Top
- Triple Bottom
- Triple Bottom
- Triple Top
- Triple Top
- All
- All
- Buy
- Sale
- All
- 1
- 2
- 3
- 4
- 5
รูปแบบกราฟจุดสองยอด (Double Top)
was formed on 06.06 at 08:50:51 (UTC+0)
signal strength 1 of 5
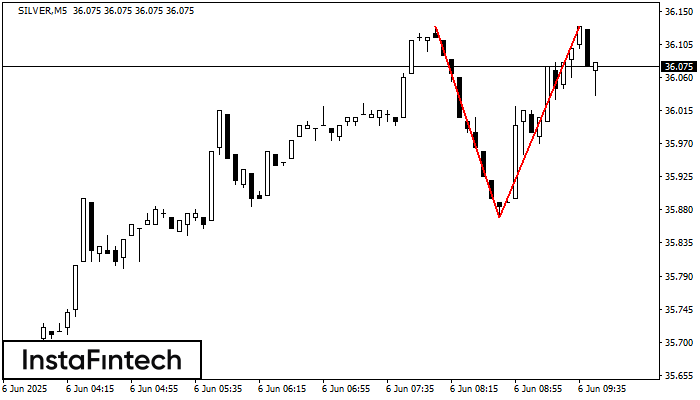
ในชาร์ตของ SILVER M5 พบว่า กราฟรูปแบบย้อนกลับ รูปแบบกราฟจุดสองยอด (Double Top) ได้ถูกสร้างขึ้นมา คุณลักษณะ: ขอบเขตด้านบน 36.13; ขอบเขตด้านล่าง 35.87; ความกว้างของกราฟรูปแบบนี้คือ
ขอบเตระยะเวลาใน M5 และ M15 อาจจะมีตำแหน่งการเข้าใช้งานที่ผิดพลาดมากยิ่งขึ้น
Open chart in a new window
รูปแบบกราฟธงปลายแหลมขาขึ้น (Bullish pennant)
was formed on 06.06 at 08:40:15 (UTC+0)
signal strength 1 of 5
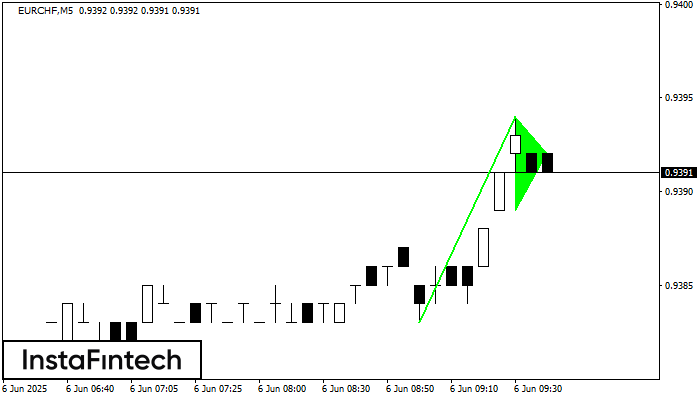
รูปแบบกราฟิก รูปแบบกราฟธงปลายแหลมขาขึ้น (Bullish pennant) ได้สร้างขึ้นมาในตราสาร EURCHF M5 รูปแบบประเภทนี้จะอยู่ใน ประเภทของรูปแบบต่อเนื่อง ในกรณีเช่นนี้ ถ้าหากมูลค่าสามารถเคลื่อนตัวทะลุผ่านระดับสูงออกไปได้ ก็คาดการณ์ว่าจะยังเคลื่อนตัวไปยังแนวโน้มขาขึ้นที่ระดับ 0.9409
ขอบเตระยะเวลาใน M5 และ M15 อาจจะมีตำแหน่งการเข้าใช้งานที่ผิดพลาดมากยิ่งขึ้น
Open chart in a new window
รูปแบบสามเหลี่ยมสมมาตรขาลง (Bearish Symmetrical Triangle)
was formed on 06.06 at 08:13:45 (UTC+0)
signal strength 3 of 5
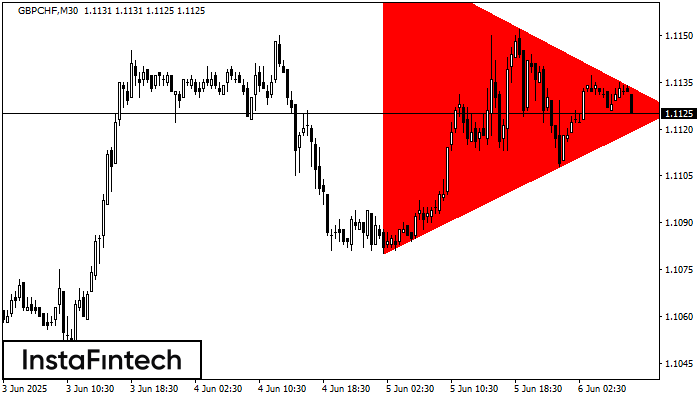
อ้างอิงจากชาร์ตของ M30, GBPCHF ที่ได้สร้างรูปแบบ รูปแบบสามเหลี่ยมสมมาตรขาลง (Bearish Symmetrical Triangle) ออกมา รูปแบบนี้แสดงถึงแนวโน้มขาลงที่เกิดขึ้นต่อไป ในกรณีที่ขอบเขตด้านล่าง 1.1080 จะมีการเคลื่อนตัวทะลุผ่าน4f ส่วนนี้ เป็นผลกำไรที่คาดการณ์ไว้
Open chart in a new window


