

รูปแบบกราฟ

รูปแบบกราฟนั้นเป็น รูปจำลองทางกราฟฟิกที่ถูกสร้างขึ้นมาในชาร์ตจากราคา อ้างอิงตามหนึ่งในการวิเคราะห์ทางเทคนิค ที่ตั้งสมมติฐานมาว่า ประวัติศาสตร์ (การเคลื่อนไหวของราคา) มักจะเกิดขึ้นซ้ำรอยเดิม นั้นหมายความว่า การเคลื่อนไหวของราคาก็หมือนกับ สถานการณ์หนึ่งที่จะสามารถทำการคาดการณ์ไปยังทิศทางในอนาคต ตามเหตุการณ์ที่น่าจะมีความเป็นไปได้สูง
รูปแบบกราฟที่สำคัญจากทาง InstaTrade นั้นจะเป็นการบริการที่มีการใช้อย่างง่ายดาย ซึ่งจะช่วยให้คุณสามารถทราบถึงการเปลี่ยนแปลงล่าสุด ในตลาดได้ และสามารถรับมือกับข้อมูลจากทางตลาดได้ทันท่วงที ในการบริการของพวกเรานั้น คุณจะพบกับรูปแบบกราฟล่าสุดและมีความสำคัญมากที่สุดในทุกๆคู่สกุลเงิน และทุกๆขอบเขตเวลา
Bearish Flag
was formed on 04.04 at 17:33:26 (UTC+0)
signal strength 2 of 5
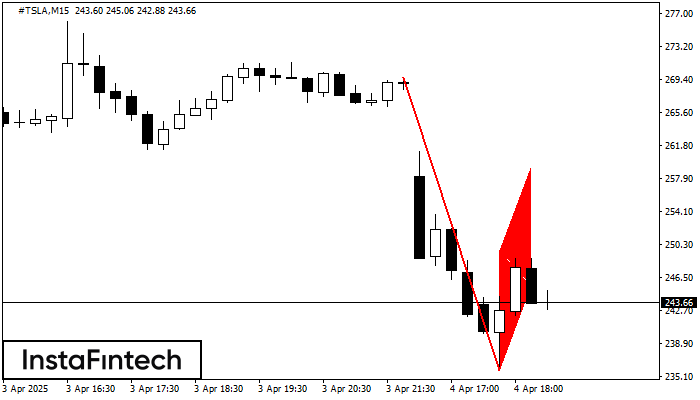
The Bearish Flag pattern has been formed on the chart #TSLA M15. Therefore, the downwards trend is likely to continue in the nearest term. As soon as the price breaks below the low at 235.81, traders should enter the market.
The M5 and M15 time frames may have more false entry points.
ดูเพิ่มเติม
- All
- All
- Bearish Rectangle
- Bearish Symmetrical Triangle
- Bearish Symmetrical Triangle
- Bullish Rectangle
- Double Top
- Double Top
- Triple Bottom
- Triple Bottom
- Triple Top
- Triple Top
- All
- All
- Buy
- Sale
- All
- 1
- 2
- 3
- 4
- 5
Double Top
was formed on 02.06 at 14:54:52 (UTC+0)
signal strength 1 of 5
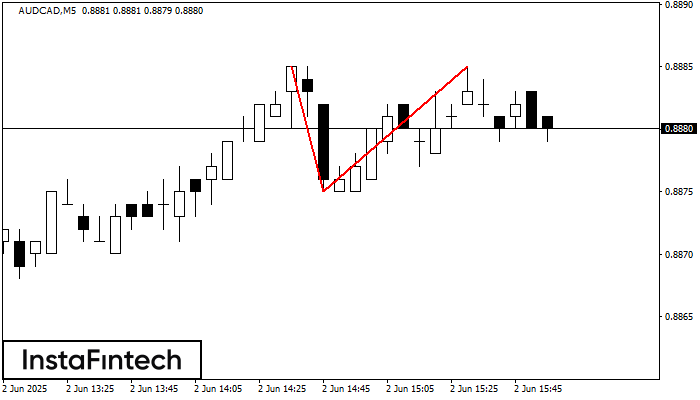
On the chart of AUDCAD M5 the Double Top reversal pattern has been formed. Characteristics: the upper boundary 0.8885; the lower boundary 0.8875; the width of the pattern 10 points
The M5 and M15 time frames may have more false entry points.
Open chart in a new window
Bearish pennant
was formed on 02.06 at 14:45:11 (UTC+0)
signal strength 4 of 5
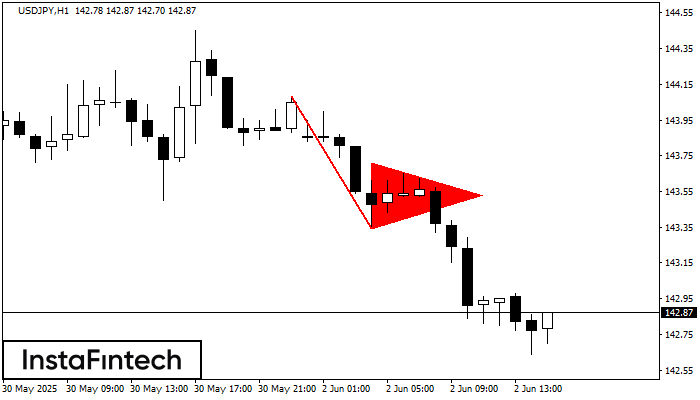
The Bearish pennant pattern has formed on the USDJPY H1 chart. It signals potential continuation of the existing trend. Specifications: the pattern’s bottom has the coordinate of 143.34; the projection
Open chart in a new window
Bullish Rectangle
was formed on 02.06 at 14:35:19 (UTC+0)
signal strength 2 of 5
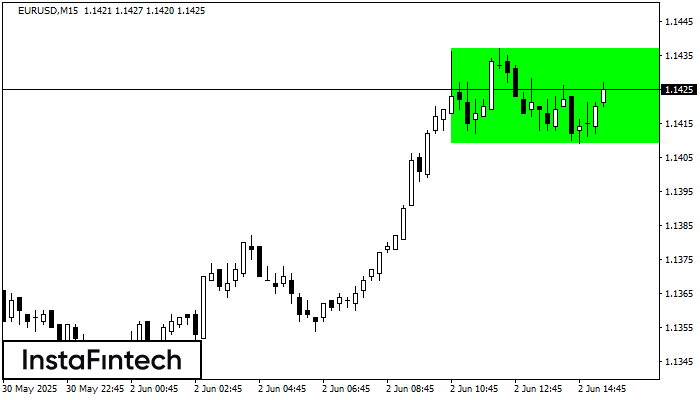
According to the chart of M15, EURUSD formed the Bullish Rectangle which is a pattern of a trend continuation. The pattern is contained within the following borders: the lower border
The M5 and M15 time frames may have more false entry points.
Open chart in a new window


