

รูปแบบกราฟ

รูปแบบกราฟนั้นเป็น รูปจำลองทางกราฟฟิกที่ถูกสร้างขึ้นมาในชาร์ตจากราคา อ้างอิงตามหนึ่งในการวิเคราะห์ทางเทคนิค ที่ตั้งสมมติฐานมาว่า ประวัติศาสตร์ (การเคลื่อนไหวของราคา) มักจะเกิดขึ้นซ้ำรอยเดิม นั้นหมายความว่า การเคลื่อนไหวของราคาก็หมือนกับ สถานการณ์หนึ่งที่จะสามารถทำการคาดการณ์ไปยังทิศทางในอนาคต ตามเหตุการณ์ที่น่าจะมีความเป็นไปได้สูง
รูปแบบกราฟที่สำคัญจากทาง InstaTrade นั้นจะเป็นการบริการที่มีการใช้อย่างง่ายดาย ซึ่งจะช่วยให้คุณสามารถทราบถึงการเปลี่ยนแปลงล่าสุด ในตลาดได้ และสามารถรับมือกับข้อมูลจากทางตลาดได้ทันท่วงที ในการบริการของพวกเรานั้น คุณจะพบกับรูปแบบกราฟล่าสุดและมีความสำคัญมากที่สุดในทุกๆคู่สกุลเงิน และทุกๆขอบเขตเวลา
Inverse Head and Shoulder
was formed on 04.04 at 09:30:33 (UTC+0)
signal strength 1 of 5
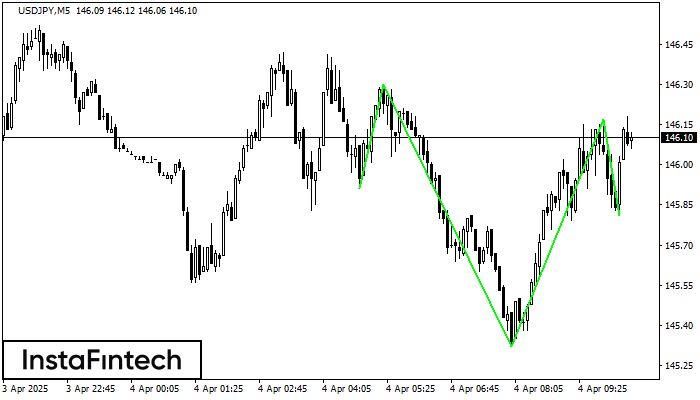
According to M5, USDJPY is shaping the technical pattern – the Inverse Head and Shoulder. In case the Neckline 146.30/146.17 is broken out, the instrument is likely to move toward 146.32.
The M5 and M15 time frames may have more false entry points.
ดูเพิ่มเติม
- All
- All
- Bearish Rectangle
- Bearish Symmetrical Triangle
- Bearish Symmetrical Triangle
- Bullish Rectangle
- Double Top
- Double Top
- Triple Bottom
- Triple Bottom
- Triple Top
- Triple Top
- All
- All
- Buy
- Sale
- All
- 1
- 2
- 3
- 4
- 5
รูปแบบสามเหลี่ยมสมมาตรขาขึ้น (Bullish Symmetrical Triangle)
was formed on 22.09 at 20:17:21 (UTC+0)
signal strength 2 of 5
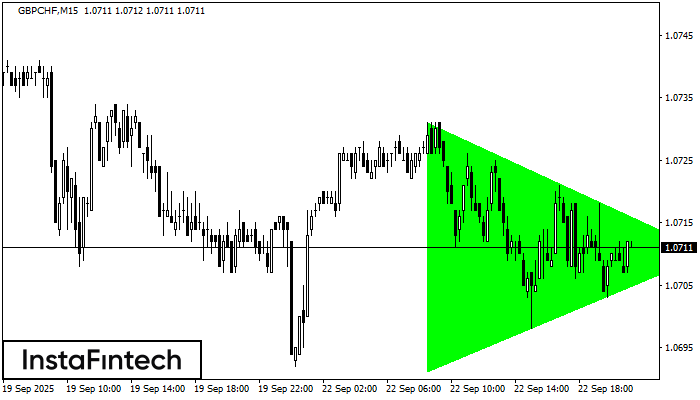
อ้างอิงจากชาร์ตของ M15, GBPCHF ที่ได้สร้างรูปแบบ รูปแบบสามเหลี่ยมสมมาตรขาขึ้น (Bullish Symmetrical Triangle) ออกมา คำอธิบาย: นี้คือรูปแบบของความต่อเนื่องในแนวโน้ม 1.0731 และ 1.0691 เป็นพิกัดของขอบเขตด้านบนและด้านล่าง
ขอบเตระยะเวลาใน M5 และ M15 อาจจะมีตำแหน่งการเข้าใช้งานที่ผิดพลาดมากยิ่งขึ้น
Open chart in a new window
รูปแบบกราฟธงปลายแหลมขาขึ้น (Bullish pennant)
was formed on 22.09 at 17:45:07 (UTC+0)
signal strength 2 of 5
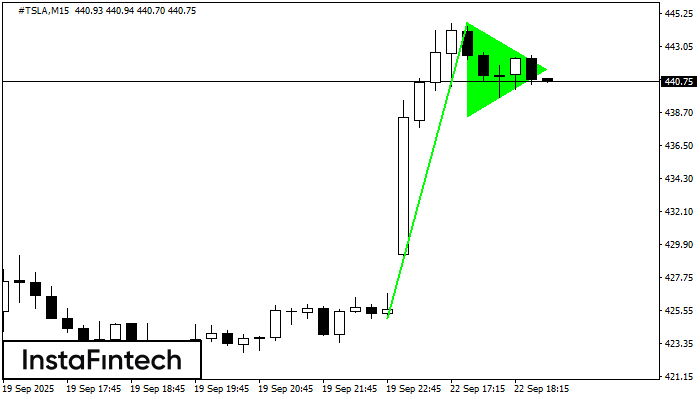
รูปแบบ รูปแบบกราฟธงปลายแหลมขาขึ้น (Bullish pennant) ได้ถูกสร้างขึ้นมาในชาร์ต #TSLA M15 มันเป็นประเภทของรูปแบบต่อเนื่อง ตามที่คาดไว้ กรณีที่ราคาทรงตัวอยุ่สูงกว่าระดับสูงสุดของกราฟรูปธงปลายแหลมที่ 444.70 ก็อาจจะมีแนวโน้มขาขึ้นต่อไป
ขอบเตระยะเวลาใน M5 และ M15 อาจจะมีตำแหน่งการเข้าใช้งานที่ผิดพลาดมากยิ่งขึ้น
Open chart in a new window
รูปแบบกราฟจุดสองยอดขาลง (Double Bottom)
was formed on 22.09 at 16:00:27 (UTC+0)
signal strength 3 of 5
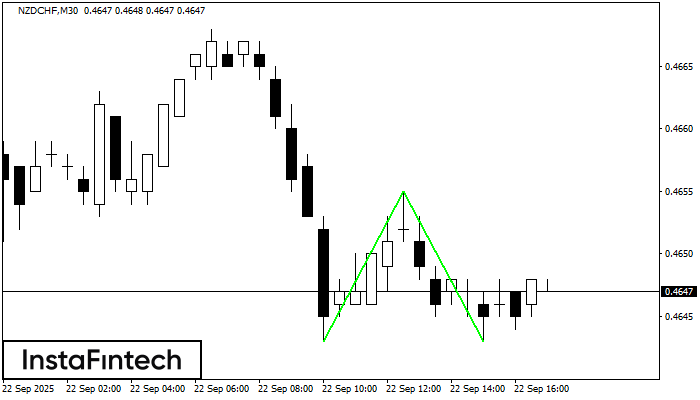
รูปแบบ รูปแบบกราฟจุดสองยอดขาลง (Double Bottom) ถูกสร้างขึ้นมาใน NZDCHF M30; ขอบเขตด้านบนอยู่ที่ 0.4655;ขอบเขตด้านล่าง คือ 0.4643 ความกว้างของรูปแบบนี้คือ 12 จุด กรณีที่มีการเคลื่อนตัวทะลุผ่านขอบเขตด้านบน
Open chart in a new window


