

รูปแบบกราฟ

รูปแบบกราฟนั้นเป็น รูปจำลองทางกราฟฟิกที่ถูกสร้างขึ้นมาในชาร์ตจากราคา อ้างอิงตามหนึ่งในการวิเคราะห์ทางเทคนิค ที่ตั้งสมมติฐานมาว่า ประวัติศาสตร์ (การเคลื่อนไหวของราคา) มักจะเกิดขึ้นซ้ำรอยเดิม นั้นหมายความว่า การเคลื่อนไหวของราคาก็หมือนกับ สถานการณ์หนึ่งที่จะสามารถทำการคาดการณ์ไปยังทิศทางในอนาคต ตามเหตุการณ์ที่น่าจะมีความเป็นไปได้สูง
รูปแบบกราฟที่สำคัญจากทาง InstaTrade นั้นจะเป็นการบริการที่มีการใช้อย่างง่ายดาย ซึ่งจะช่วยให้คุณสามารถทราบถึงการเปลี่ยนแปลงล่าสุด ในตลาดได้ และสามารถรับมือกับข้อมูลจากทางตลาดได้ทันท่วงที ในการบริการของพวกเรานั้น คุณจะพบกับรูปแบบกราฟล่าสุดและมีความสำคัญมากที่สุดในทุกๆคู่สกุลเงิน และทุกๆขอบเขตเวลา
Triple Bottom
was formed on 04.04 at 01:30:32 (UTC+0)
signal strength 2 of 5
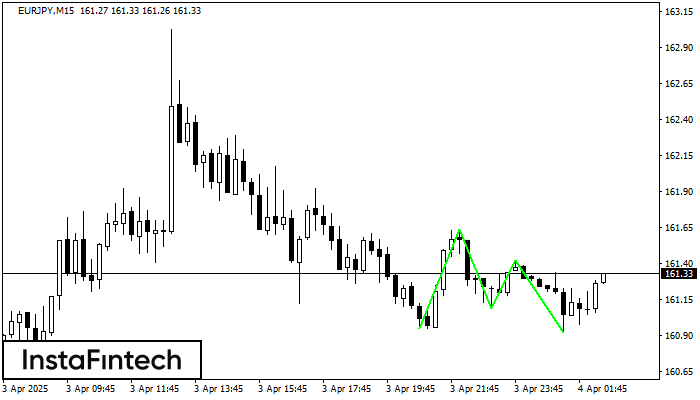
The Triple Bottom pattern has formed on the chart of EURJPY M15. Features of the pattern: The lower line of the pattern has coordinates 161.64 with the upper limit 161.64/161.42, the projection of the width is 69 points. The formation of the Triple Bottom pattern most likely indicates a change in the trend from downward to upward. This means that in the event of a breakdown of the resistance level 160.95, the price is most likely to continue the upward movement.
The M5 and M15 time frames may have more false entry points.
ดูเพิ่มเติม
- All
- All
- Bearish Rectangle
- Bearish Symmetrical Triangle
- Bearish Symmetrical Triangle
- Bullish Rectangle
- Double Top
- Double Top
- Triple Bottom
- Triple Bottom
- Triple Top
- Triple Top
- All
- All
- Buy
- Sale
- All
- 1
- 2
- 3
- 4
- 5
รูปแบบกราฟธงปลายแหลมขาลง (Bearish pennant)
was formed on 08.09 at 23:28:04 (UTC+0)
signal strength 1 of 5
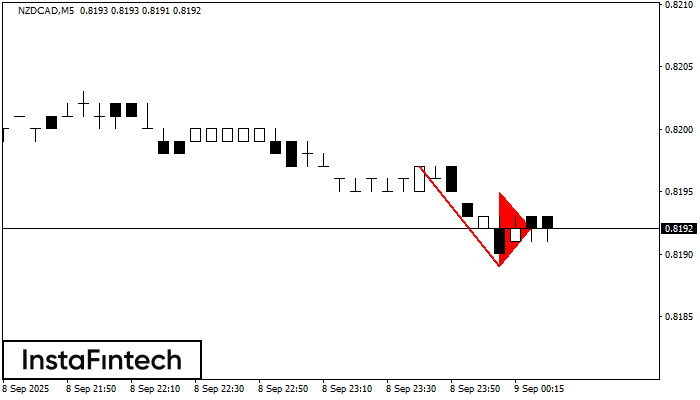
รูปแบบ รูปแบบกราฟธงปลายแหลมขาลง (Bearish pennant) ได้สร้างขึ้นมาในชาร์ต NZDCAD M5 รูปแบบนี้แสดงถึงความต่องเนื่องของแนวโน้มขาลง กรณีที่มีการเคลื่อนตัวทะลุผ่านของระดับต่ำในรูปธงปลายแหลมที่ 0.8189 ออกไป คำแนะนำ: กำหนดคำสั่งซื้อขายล่วงหน้า(pending order)
ขอบเตระยะเวลาใน M5 และ M15 อาจจะมีตำแหน่งการเข้าใช้งานที่ผิดพลาดมากยิ่งขึ้น
Open chart in a new window
รูปแบบกราฟหัวและหัวไหล่ (Head and Shoulders)
was formed on 08.09 at 23:18:03 (UTC+0)
signal strength 2 of 5
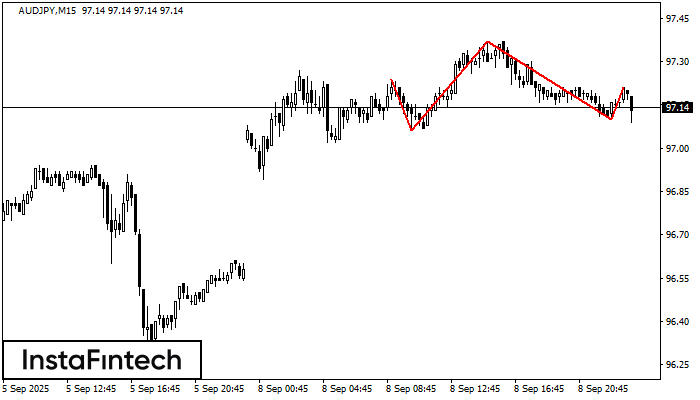
AUDJPY M15 ได้สร้างรูปแบบ รูปแบบกราฟหัวและหัวไหล่ (Head and Shoulders) พร้อมกับคุณลักษณะดังต่อไปนี้ : ระดับสูงของตำแหน่งหัวอยู่ที่ 97.37, ตำแหน่งคอ และมุมขาขึ้นอยู่ที่ 97.06/97.10 การก่อตัวของรูปแบบเช่นนี้
ขอบเตระยะเวลาใน M5 และ M15 อาจจะมีตำแหน่งการเข้าใช้งานที่ผิดพลาดมากยิ่งขึ้น
Open chart in a new window
รูปแบบกราฟจุดสองยอด (Double Top)
was formed on 08.09 at 23:00:25 (UTC+0)
signal strength 3 of 5
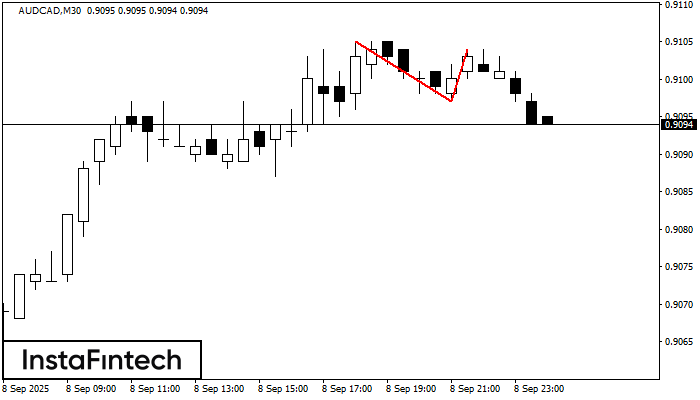
รูปแบบการย้อนตัว รูปแบบกราฟจุดสองยอด (Double Top) ได้ถูกสร้างขึ้นมาใน AUDCAD M30 คุณลักษณะ: ขอบเขตด้านบน 0.9105; ขอบเขตด้านล่าง 0.9097; ความกว้างของกราฟรูปแบบนี้คือ 7 จุด
Open chart in a new window


