

รูปแบบกราฟ

รูปแบบกราฟนั้นเป็น รูปจำลองทางกราฟฟิกที่ถูกสร้างขึ้นมาในชาร์ตจากราคา อ้างอิงตามหนึ่งในการวิเคราะห์ทางเทคนิค ที่ตั้งสมมติฐานมาว่า ประวัติศาสตร์ (การเคลื่อนไหวของราคา) มักจะเกิดขึ้นซ้ำรอยเดิม นั้นหมายความว่า การเคลื่อนไหวของราคาก็หมือนกับ สถานการณ์หนึ่งที่จะสามารถทำการคาดการณ์ไปยังทิศทางในอนาคต ตามเหตุการณ์ที่น่าจะมีความเป็นไปได้สูง
รูปแบบกราฟที่สำคัญจากทาง InstaTrade นั้นจะเป็นการบริการที่มีการใช้อย่างง่ายดาย ซึ่งจะช่วยให้คุณสามารถทราบถึงการเปลี่ยนแปลงล่าสุด ในตลาดได้ และสามารถรับมือกับข้อมูลจากทางตลาดได้ทันท่วงที ในการบริการของพวกเรานั้น คุณจะพบกับรูปแบบกราฟล่าสุดและมีความสำคัญมากที่สุดในทุกๆคู่สกุลเงิน และทุกๆขอบเขตเวลา
Bullish pennant
was formed on 01.04 at 22:25:52 (UTC+0)
signal strength 1 of 5
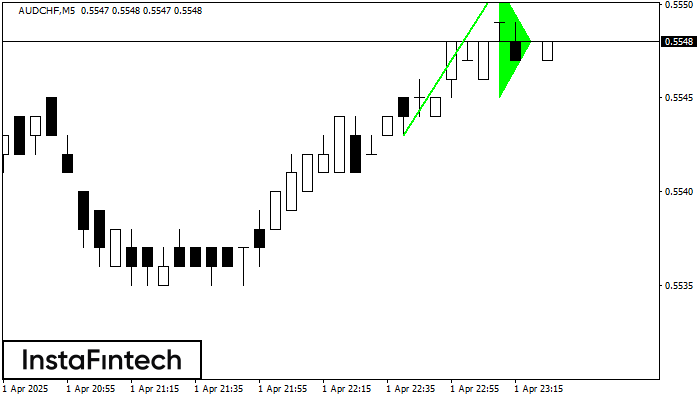
The Bullish pennant graphic pattern has formed on the AUDCHF M5 instrument. This pattern type falls under the category of continuation patterns. In this case, if the quote can breaks out high, is expected to continue the upward trend to level 0.5566.
The M5 and M15 time frames may have more false entry points.
- All
- All
- Bearish Rectangle
- Bearish Symmetrical Triangle
- Bearish Symmetrical Triangle
- Bullish Rectangle
- Double Top
- Double Top
- Triple Bottom
- Triple Bottom
- Triple Top
- Triple Top
- All
- All
- Buy
- Sale
- All
- 1
- 2
- 3
- 4
- 5
Bullish Flag
сформирован 17.04 в 13:38:24 (UTC+0)
сила сигнала 1 из 5
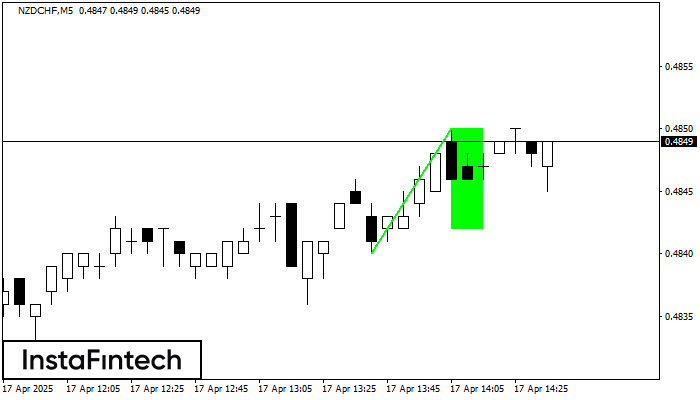
The Bullish Flag pattern has been formed on the chart NZDCHF M5 which signals that the upward trend will continue. Signals: а break of the peak at 0.4850 may push
The M5 and M15 time frames may have more false entry points.
Открыть график инструмента в новом окне
Triple Bottom
сформирован 17.04 в 13:35:08 (UTC+0)
сила сигнала 1 из 5
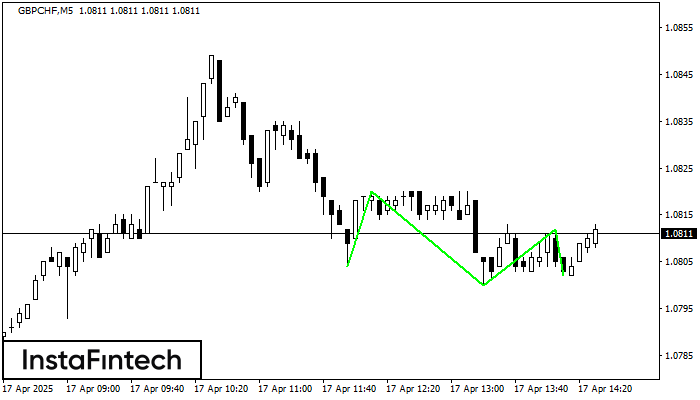
The Triple Bottom pattern has formed on the chart of GBPCHF M5. Features of the pattern: The lower line of the pattern has coordinates 1.0820 with the upper limit 1.0820/1.0812
The M5 and M15 time frames may have more false entry points.
Открыть график инструмента в новом окне
Double Top
сформирован 17.04 в 12:14:50 (UTC+0)
сила сигнала 1 из 5

The Double Top pattern has been formed on GBPUSD M5. It signals that the trend has been changed from upwards to downwards. Probably, if the base of the pattern 1.3238
The M5 and M15 time frames may have more false entry points.
Открыть график инструмента в новом окне


