

รูปแบบกราฟ

รูปแบบกราฟนั้นเป็น รูปจำลองทางกราฟฟิกที่ถูกสร้างขึ้นมาในชาร์ตจากราคา อ้างอิงตามหนึ่งในการวิเคราะห์ทางเทคนิค ที่ตั้งสมมติฐานมาว่า ประวัติศาสตร์ (การเคลื่อนไหวของราคา) มักจะเกิดขึ้นซ้ำรอยเดิม นั้นหมายความว่า การเคลื่อนไหวของราคาก็หมือนกับ สถานการณ์หนึ่งที่จะสามารถทำการคาดการณ์ไปยังทิศทางในอนาคต ตามเหตุการณ์ที่น่าจะมีความเป็นไปได้สูง
รูปแบบกราฟที่สำคัญจากทาง InstaTrade นั้นจะเป็นการบริการที่มีการใช้อย่างง่ายดาย ซึ่งจะช่วยให้คุณสามารถทราบถึงการเปลี่ยนแปลงล่าสุด ในตลาดได้ และสามารถรับมือกับข้อมูลจากทางตลาดได้ทันท่วงที ในการบริการของพวกเรานั้น คุณจะพบกับรูปแบบกราฟล่าสุดและมีความสำคัญมากที่สุดในทุกๆคู่สกุลเงิน และทุกๆขอบเขตเวลา
Inverse Head and Shoulder
was formed on 19.03 at 21:00:45 (UTC+0)
signal strength 3 of 5

According to M30, AUDCHF is shaping the technical pattern – the Inverse Head and Shoulder. In case the Neckline 0.5584/0.5578 is broken out, the instrument is likely to move toward 0.5608.
ดูเพิ่มเติม
- All
- All
- Bearish Rectangle
- Bearish Symmetrical Triangle
- Bearish Symmetrical Triangle
- Bullish Rectangle
- Double Top
- Double Top
- Triple Bottom
- Triple Bottom
- Triple Top
- Triple Top
- All
- All
- Buy
- Sale
- All
- 1
- 2
- 3
- 4
- 5
Đáy đôi
was formed on 22.08 at 12:00:25 (UTC+0)
signal strength 4 of 5
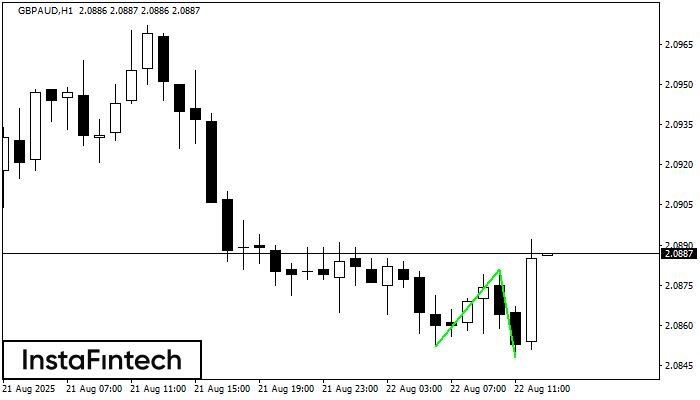
Mô hình Đáy đôi đã được hình thành trên GBPAUD H1. Đặc điểm: mức hỗ trợ 2.0852; mức kháng cự 2.0881; chiều rộng của mô hình 29 điểm
Open chart in a new window
Tam giác Cân Tăng
was formed on 22.08 at 09:45:52 (UTC+0)
signal strength 1 of 5
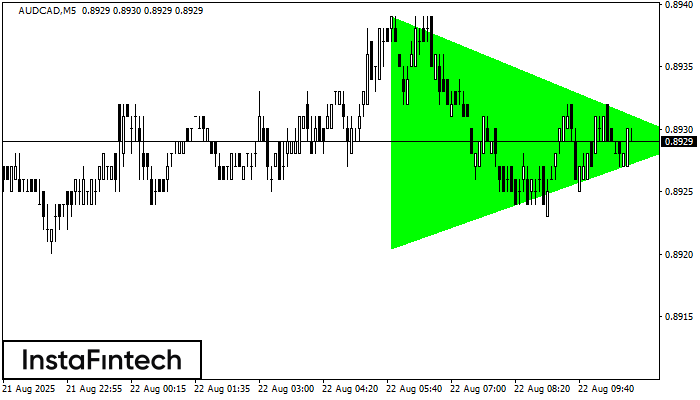
Theo biểu đồ của M5, AUDCAD đã hình thành mô hình Tam giác Cân Tăng. Đường biên giới thấp hơn của mô hình chạm tọa độ 0.8920/0.8929 trong khi đường
Khung thời gian M5 và M15 có thể có nhiều điểm vào lệnh sai hơn.
Open chart in a new window
Đỉnh đôi
was formed on 22.08 at 07:30:33 (UTC+0)
signal strength 3 of 5
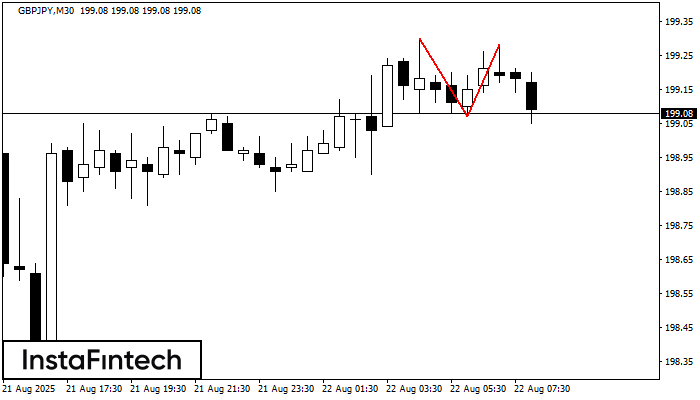
Mô hình đảo chiều Đỉnh đôi đã được hình thành trên GBPJPY M30. Đặc điểm: ranh giới trên 199.30; ranh giới dưới 199.07; chiều rộng của mô hình
Open chart in a new window


