อ่านรายละเอียดเพิ่มเติม


 28.12.2022 01:53 PM
U.S. markets are closed on Monday in observance of Christmas Day, which falls on Sunday. U.S. indices were up on Friday, while the inflation data released on Friday is being accessed as the market diverges in outlook vs the Fed. The Dow Jones was up 0.53% to 33,203.93, the S&P500 rose 0.59% to 3,844.82, and the NASDAQ was up 0.21% to 10,497.86. At the same time, oil prices jumped.
Notable News
What To Watch This Week
Long-term view on market and 2023 outlook:
In general, investors are still concerned about the market outlook and the fears are increasing. The economic recession seems inevitable, as major monetary authorities are determined to continue to battle high inflation. In my view, monetary policy will turn accommodative as inflation trends down. Growth pressures still weigh on developed markets' equity in 1Q 2023, but a turn in monetary policy will provide liquidity support to asset prices. Consensus expects interest rates to peak around 5.0% in the middle of 2023, which indicates it is closer to the end of the hiking cycle. I remain cautious on U.S. equities into 1Q 2023, and I believe the market will be more positive as markets bottom out in 2Q 2023.
27th December trading analysis
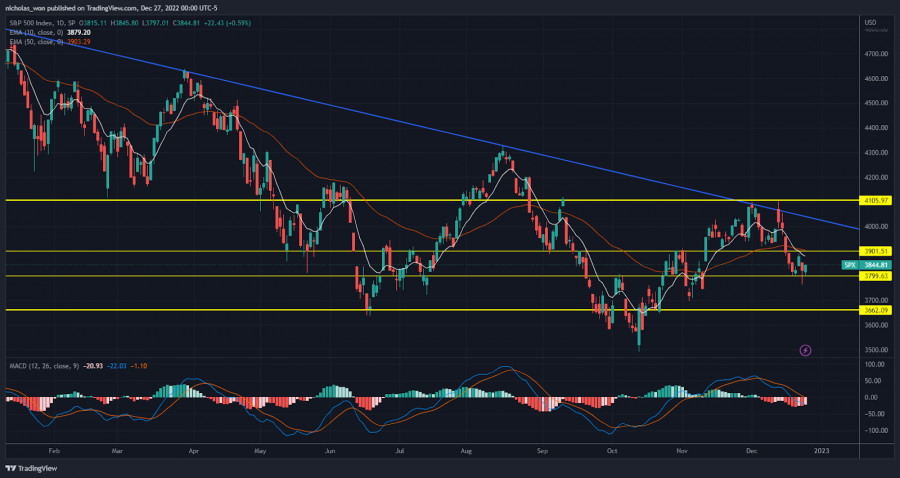
S&P 500 daily chart:
The S&P 500 index finished higher in a turbulent pre-holiday session Friday, as an inflation report and a slew of other data did nothing to change views that the Federal Reserve would likely keep raising interest rates even if the economy slowed. From the daily chart, the price is hovering between $3,784 support level and $3,947 resistance level. It is crucial to continue to watch the price movement in these few days to see whether the bull traders will successfully break through the $3,947 resistance level and push it to the next support level at around $4,072, or the bear traders will pull the price to the $3,784 support line and continue fall to the $3,662 support line. Traders may find an opportunity to trade between $3,784 and $3,947 as the index already traded in this range for a few days. Nonetheless, given the Fed would likely continue to raise the interest rate and the index is still trading below its 10MA and 50MA lines, I suggest traders remain cautious.
You have already liked this post today
*บทวิเคราะห์ในตลาดที่มีการโพสต์ตรงนี้ เพียงเพื่อทำให้คุณทราบถึงข้อมูล ไม่ได้เป็นการเจาะจงถึงขั้นตอนให้คุณทำการซื้อขายตาม
วันนี้ราคาทองคำปรับตัวสูงขึ้น เนื่องจากนักลงทุนยังคงวิตกกังวลเกี่ยวกับความไม่แน่นอนที่เกี่ยวข้องกับภาษีการค้า ปัญหาทางการคลังในสหรัฐฯ และความเสี่ยงทางภูมิรัฐศาสตร์ ซึ่งปัจจัยเหล่านี้เพิ่มความต้องการสินทรัพย์ที่ปลอดภัยในการลงทุน นอกจากนี้ ความคาดหวังที่ว่า Federal Reserve จะปรับลดอัตราดอกเบี้ยยังส่งผลให้ผู้ซื้อเงินดอลลาร์ไม่สามารถดำเนินการอย่างก้าวร้าวได้ สร้างเงื่อนไขที่เอื้ออำนวยต่อการเติบโตต่อไปของคู่ XAU/USD ในแง่เทคนิค การทะลุระดับจิตวิทยาหลักที่ $3300
ในช่วงต้นของการซื้อขายในอเมริกา ค่าเงินยูโรซื้อขายอยู่ประมาณ 1.1320 ภายในช่องแนวโน้มขาขึ้นที่เกิดขึ้นในกราฟ H4 ตั้งแต่วันที่ 9 พฤษภาคม และแสดงสัญญาณของความอ่อนล้า ถ้าค่าเงินยูโรยังคงอยู่ในวัฏจักรขาขึ้น เราอาจคาดว่าจะทะลุและมีการยืนยันที่ระดับ 1.1354 จากนั้นอาจถึงระดับ 7/8 ของมิวเรย์ที่
ในช่วงต้นของเซสชันอเมริกา ราคาทองคำกำลังซื้อขายอยู่ที่ประมาณ 3,306 ภายในช่องทางแนวโน้มขาลงที่เกิดขึ้นในแผนภูมิ H1 ตั้งแต่วันที่ 23 พฤษภาคม โลหะสีเหลืองมีแนวโน้มที่จะดำเนินรอบขาลงต่อไปในชั่วโมงต่อ ๆ ไปหากราคายังคงต่ำกว่าค่าเฉลี่ยเคลื่อนที่แบบธรรมดา 21 หรือ ต่ำกว่า 3,310
เมื่อวันอังคาร คู่เงิน EUR/USD ได้มีการเคลื่อนตัวรวมอยู่ที่ต่ำกว่าบริเวณ 1.1374–1.1380 และต่อมาเด้งกลับด้านล่างบริเวณดังกล่าว ซึ่งเป็นการยืนยันถึงแนวโน้มขาลงต่อไป และการปิดต่ำกว่า 50.0% ระดับการเก็บกำไรคืนที่ 1.1320 บ่งบอกว่าคู่นี้อาจมีแนวโน้มลดลงต่อไปสู่บริเวณ 1.1260–1.1282 การเด้งกลับจากระดับหรือโซนสนับสนุนใดๆ อาจเป็นชนวนให้เกิดการปรับตัวขึ้นใหม่อีกครั้ง
ลิงก์ที่มีประโยชน์: บทความอื่นๆ ของฉันอยู่ในส่วนนี้ คอร์สพื้นฐานสำหรับผู้เริ่มต้นของ InstaForex การวิเคราะห์ที่ได้รับความนิยม เปิดบัญชีซื้อขาย สำคัญ: ผู้เริ่มต้นในตลาดแลกเปลี่ยนเงินตราต่างประเทศ (forex trading) ควรระมัดระวังอย่างยิ่งเมื่อทำการตัดสินใจเกี่ยวกับการเข้าสู่ตลาด ก่อนที่จะมีการเผยแพร่รายงานที่สำคัญ ควรหลีกเลี่ยงการเข้าสู่ตลาดเพื่อป้องกันการผันผวนที่รุนแรงซึ่งเกิดจากความเปลี่ยนแปลงของความผันผวนที่เพิ่มขึ้น หากคุณตัดสินใจที่จะทำการซื้อขายในช่วงที่มีการเผยแพร่ข่าว
ในชาร์ตรายชั่วโมงของคู่เงิน GBP/USD ราคายังคงลดลงต่อไปในวันอังคารและยืนใต้ระดับ Fibonacci retracement 161.8% ที่ 1.3520 ซึ่งหมายความว่าแนวโน้มขาลงอาจจะดำเนินต่อไปในวันนี้ไปสู่เป้าหมายถัดไปที่ 1.3425 การยืนเหนือ 1.3520 หรือการรีบาวน์จาก 1.3425 จะเป็นปัจจัยบวกต่อสกุลเงินปอนด์และส่งสัญญาณถึงการกลับมาเติบโตอีกครั้ง
เมื่อเกิดการบรรจบกันระหว่างการเคลื่อนไหวของคู่สกุลเงิน AUD/JPY กับตัวบ่งชี้ Stochastic Oscillator ซึ่งได้รับการยืนยันเพิ่มเติมจากการเคลื่อนไหวของราคาที่กำลังเคลื่อนที่เหนือ WMA (21) ที่มีแนวโน้มเอียงขึ้นไปในกราฟ 4 ชั่วโมง ในอนาคตอันใกล้นี้ AUD/JPY มีโอกาสที่จะเสริมสร้างไปทางทิศเหนือ ซึ่งระดับ
ในวันอังคาร ยูโรเผชิญการปรับตัวทางเทคนิคจากระดับแนวต้านที่ 1.1420 ในวันเดียวกัน ราคาทองคำได้ปรับตัวลดลง 1.14%, น้ำมันดิบ WTI ลดลง 0.44%, และผลตอบแทนพันธบัตรรัฐบาลก็ปรับตัวลดลง อย่างไรก็ตาม ตลาดหุ้นยังคงมีความเคลื่อนไหวในทางบวก ซึ่งสัญญาณถึงความต้องการความเสี่ยงที่ยังคงมีอยู่ (S&P
ในวันอังคาร ค่าเงินปอนด์อังกฤษชะงักเพื่อเข้าสู่ช่องแคบระหว่างเส้นช่องราคากับระดับเป้าหมายที่ 1.3635 ในบริบทที่ดัชนีดอลลาร์สหรัฐเพิ่มขึ้น 0.42% ความพยายามดังกล่าวน่าจะล้มเหลว ขณะนี้ราคากำลังอยู่ในช่วงการรวมตัวเพื่อเตรียมพร้อมสำหรับการเคลื่อนไหวขึ้นในที่สุด การทะลุผ่านลิ่มที่จุดแคบที่สุดโดยเฉพาะอย่างยิ่งที่จุดยอด "แม่เหล็ก" ของลิ่มนั้นท้าทายมากยิ่งขึ้น ขณะนี้ออสซิลเลเตอร์ Marlin ที่ลดลงช่วยให้มีการทดสอบระดับการสนับสนุนที่ 1.3433 เมื่อลงตัวแก้ไขเสร็จสมบูรณ์แล้ว
เมื่อวานนี้ คู่เงิน USD/JPY มีการเติบโตที่แข็งแกร่ง—0.90% หรือ 149 pips—ซึ่งเป็นผลมาจากการแข็งค่าขึ้นของดัชนีดอลลาร์สหรัฐฯ ที่ 0.42% ทำให้ราคาขณะนี้มีการซื้อขายอยู่เหนือสมดุลรายวัน และเส้นของตัวบ่งชี้ MACD นอกจากนี้ออสซิลเลเตอร์ Marlin ก็เคลื่อนตัวเข้าสู่แดนบวกแล้วด้วย
Your IP address shows that you are currently located in the USA. If you are a resident of the United States, you are prohibited from using the services of InstaFintech Group including online trading, online transfers, deposit/withdrawal of funds, etc.
If you think you are seeing this message by mistake and your location is not the US, kindly proceed to the website. Otherwise, you must leave the website in order to comply with government restrictions.
Why does your IP address show your location as the USA?
Please confirm whether you are a US resident or not by clicking the relevant button below. If you choose the wrong option, being a US resident, you will not be able to open an account with InstaTrade anyway.
We are sorry for any inconvenience caused by this message.

