Vea también


El patrón Doble Techo es un patrón de reversión fácilmente reconocible. Este patrón, por lo general, se forma cerca del nivel de resistencia y señala una situación en el mercado cuando el precio cae para romper la línea de resistencia dos veces seguidas.
El patrón Doble Techo es un patrón de reversión fácilmente reconocible. Este patrón, por lo general, se forma cerca del nivel de resistencia y señala una situación en el mercado cuando el precio cae para romper la línea de resistencia dos veces seguidas.Abajo puede ver una imagen del patrón Doble Techo.
De modo importante, el segundo techo en la imagen es ligeramente más bajo que el primero, que es una señal obvia de que el nivel de resistencia no se romperá y que el precio seguramente revertirá. Es mejor que los operadores ingresen en el mercado cuando el precio se ubique en el segundo techo o al nivel de la línea del cuello.
Veamos qué desarrollos podemos apreciar:
La amplitud de una caída normalmente equivale la altura del patrón Doble Techo. Los operadores con experiencia dicen que estos patrones es mejor encontrarlos solo después de tendencias realmente fuertes. Por ejemplo, en el mercado lateral lento, dichas cifras no son de importancia. Además, dichos patrones por lo general se encuentran en tiempos de marcos más grandes que empiezan desde 1 hora.
El patrón Doble Piso ha sido formado en GBPJPY M30. Características: el nivel de soporte 193.37; el nivel de resistencia 194.63; el ancho del patrón 126 puntos. Si el nivel
Open chart in a new window
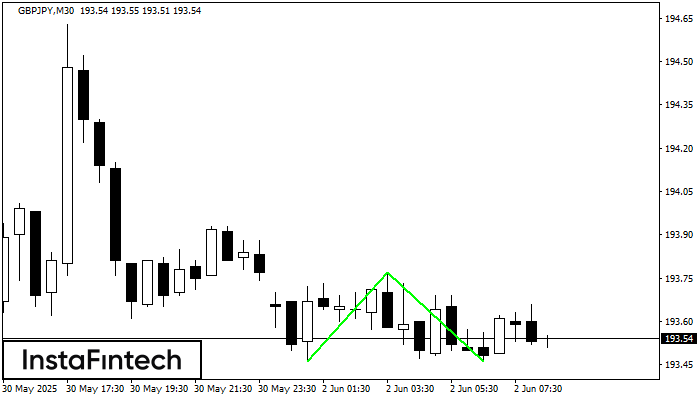
El patrón Doble Piso ha sido formado en GBPJPY M30. Características: el nivel de soporte 193.46; el nivel de resistencia 193.77; el ancho del patrón 31 puntos. Si el nivel
Open chart in a new window
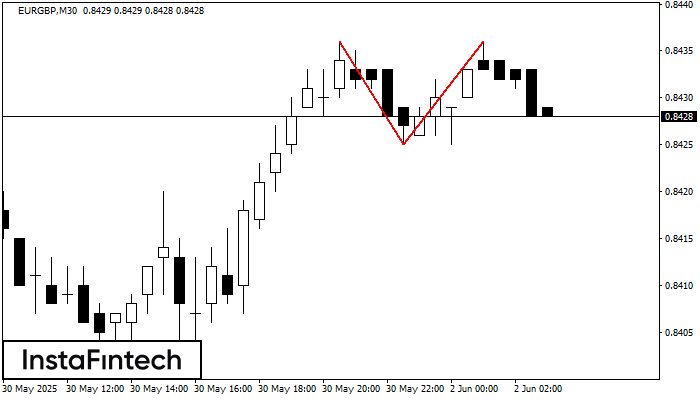
El patrón Doble Techo ha sido formado en EURGBP M30. Esto señala que la tendencia ha sido cambiada de alcista a bajista. Probablemente, si la base del patrón 0.8425
Open chart in a new window


Your IP address shows that you are currently located in the USA. If you are a resident of the United States, you are prohibited from using the services of InstaFintech Group including online trading, online transfers, deposit/withdrawal of funds, etc.
If you think you are seeing this message by mistake and your location is not the US, kindly proceed to the website. Otherwise, you must leave the website in order to comply with government restrictions.
Why does your IP address show your location as the USA?
Please confirm whether you are a US resident or not by clicking the relevant button below. If you choose the wrong option, being a US resident, you will not be able to open an account with InstaTrade anyway.
We are sorry for any inconvenience caused by this message.