

Patrones actuales

Los patrones son modelos gráficos que se forman en el gráfico mediante el precio. Según uno de los postulados del análisis técnico, la historia (movimiento del precio) se repite. Esto quiere decir que los movimientos del precio a menudo son similares en las mismas situaciones que hacen posible pronosticar el futuro desarrollo de la situación con una alta probabilidad.
Los patrones relevantes de InstaTrade son un servicio fácil de utilizar que permiten que conozca los últimos cambios en el mercado y reaccione a las pistas del mercado a tiempo. En nuestro servicio, siempre encontrará los últimos y más importantes patrones en cualquier par y en cualquier marco de tiempo.
Bullish Symmetrical Triangle
was formed on 16.04 at 05:26:29 (UTC+0)
signal strength 1 of 5
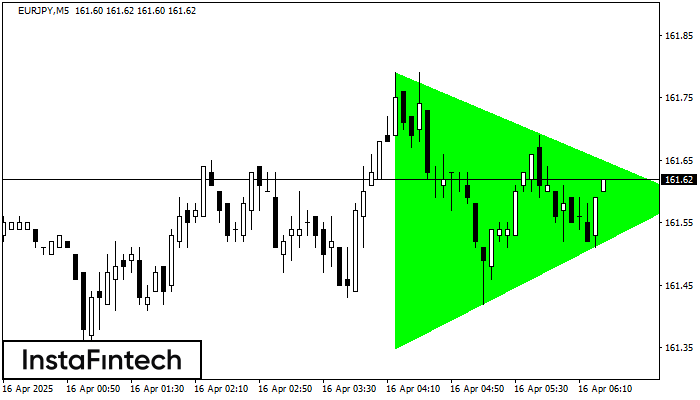
According to the chart of M5, EURJPY formed the Bullish Symmetrical Triangle pattern. The lower border of the pattern touches the coordinates 161.35/161.59 whereas the upper border goes across 161.79/161.59. If the Bullish Symmetrical Triangle pattern is in progress, this evidently signals a further upward trend. In other words, in case the scenario comes true, the price of EURJPY will breach the upper border to head for 161.74.
The M5 and M15 time frames may have more false entry points.
- All
- All
- Bearish Rectangle
- Bearish Symmetrical Triangle
- Bearish Symmetrical Triangle
- Bullish Rectangle
- Double Top
- Double Top
- Triple Bottom
- Triple Bottom
- Triple Top
- Triple Top
- All
- All
- Buy
- Sale
- All
- 1
- 2
- 3
- 4
- 5
Triángulo Simétrico Bajista
was formed on 22.05 at 19:51:05 (UTC+0)
signal strength 1 of 5
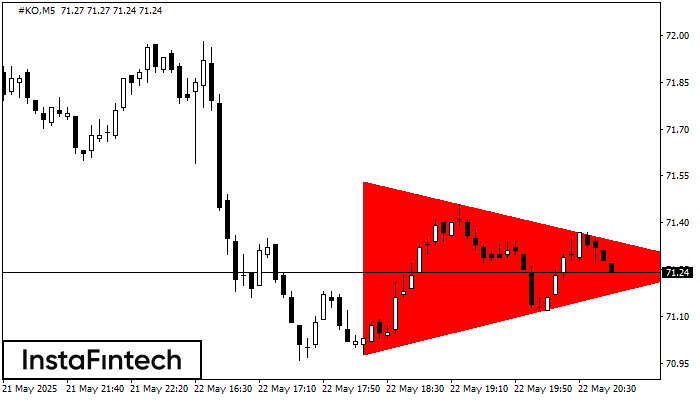
Según el gráfico de M5, el #KO formó el patrón Triángulo Simétrico Bajista. Recomendaciones de negociación: es posible que una ruptura del límite inferior 70.98 fomente una continuación
Los marcos de tiempo M5 y M15 pueden tener más puntos de entrada falsos.
Open chart in a new window
Triple Piso
was formed on 22.05 at 19:45:54 (UTC+0)
signal strength 1 of 5
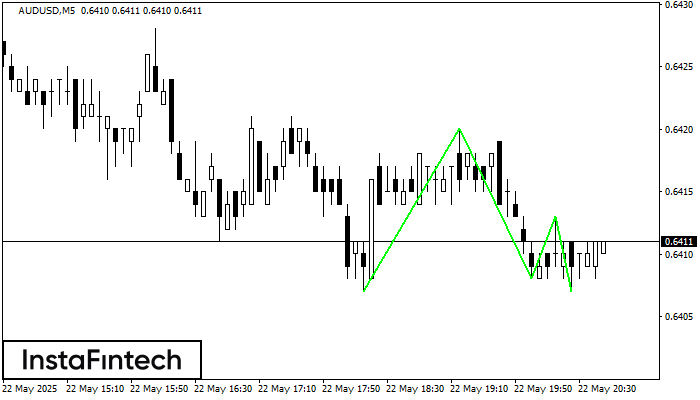
El patrón Triple Piso ha sido formado en el gráfico de AUDUSD M5. Características del patrón: línea inferior del patrón tiene coordenadas 0.6420 con el límite superior 0.6420/0.6413, la proyección
Los marcos de tiempo M5 y M15 pueden tener más puntos de entrada falsos.
Open chart in a new window
Doble Techo
was formed on 22.05 at 19:15:10 (UTC+0)
signal strength 1 of 5
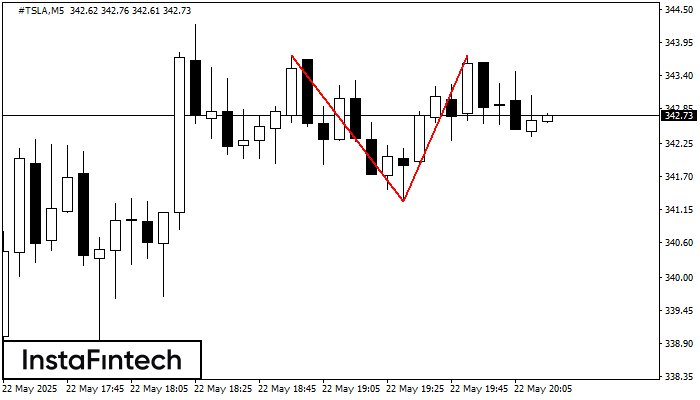
El patrón de reversión Doble Techo ha sido formado en #TSLA M5. Características: el límite superior 343.73; el límite inferior 341.29; el ancho del patrón es 245 puntos. Es mejor
Los marcos de tiempo M5 y M15 pueden tener más puntos de entrada falsos.
Open chart in a new window


