

Patrones actuales

Los patrones son modelos gráficos que se forman en el gráfico mediante el precio. Según uno de los postulados del análisis técnico, la historia (movimiento del precio) se repite. Esto quiere decir que los movimientos del precio a menudo son similares en las mismas situaciones que hacen posible pronosticar el futuro desarrollo de la situación con una alta probabilidad.
Los patrones relevantes de InstaTrade son un servicio fácil de utilizar que permiten que conozca los últimos cambios en el mercado y reaccione a las pistas del mercado a tiempo. En nuestro servicio, siempre encontrará los últimos y más importantes patrones en cualquier par y en cualquier marco de tiempo.
Double Top
was formed on 15.04 at 15:59:45 (UTC+0)
signal strength 3 of 5
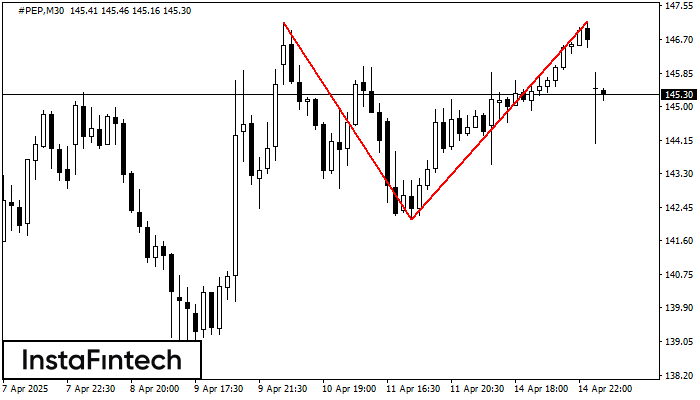
On the chart of #PEP M30 the Double Top reversal pattern has been formed. Characteristics: the upper boundary 147.15; the lower boundary 142.13; the width of the pattern 502 points. The signal: a break of the lower boundary will cause continuation of the downward trend targeting the 141.83 level.
- All
- All
- Bearish Rectangle
- Bearish Symmetrical Triangle
- Bearish Symmetrical Triangle
- Bullish Rectangle
- Double Top
- Double Top
- Triple Bottom
- Triple Bottom
- Triple Top
- Triple Top
- All
- All
- Buy
- Sale
- All
- 1
- 2
- 3
- 4
- 5
Triángulo Simétrico Alcista
was formed on 22.05 at 08:01:53 (UTC+0)
signal strength 3 of 5

Según el gráfico de M30, EURUSD formó el patrón Triángulo Simétrico Alcista, que señala que la tendencia continuará. Descripción. El límite superior del patrón toca las coordenadas 1.1362/1.1333 donde
Open chart in a new window
Banderín bajista
was formed on 22.05 at 08:00:35 (UTC+0)
signal strength 4 of 5

El patrón Banderín bajista se ha formado en el gráfico NZDCAD H1. El patrón señala la continuación de la tendencia bajista en caso de que se rompa el mínimo
Open chart in a new window
Triple Piso
was formed on 22.05 at 07:26:02 (UTC+0)
signal strength 1 of 5
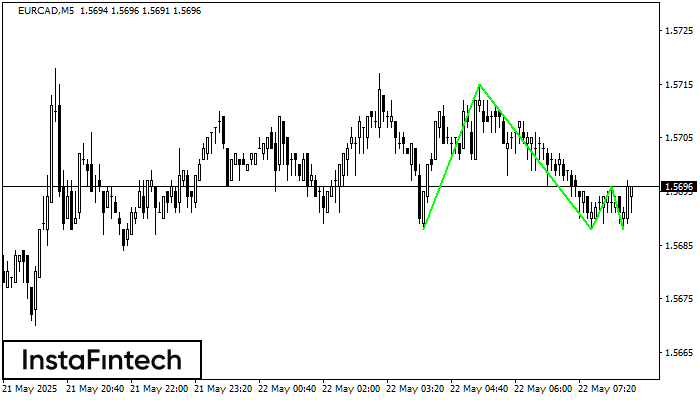
El patrón Triple Piso ha sido formado en el gráfico de EURCAD M5. Características del patrón: línea inferior del patrón tiene coordenadas 1.5715 con el límite superior 1.5715/1.5696, la proyección
Los marcos de tiempo M5 y M15 pueden tener más puntos de entrada falsos.
Open chart in a new window


