

Patrones actuales

Los patrones son modelos gráficos que se forman en el gráfico mediante el precio. Según uno de los postulados del análisis técnico, la historia (movimiento del precio) se repite. Esto quiere decir que los movimientos del precio a menudo son similares en las mismas situaciones que hacen posible pronosticar el futuro desarrollo de la situación con una alta probabilidad.
Los patrones relevantes de InstaTrade son un servicio fácil de utilizar que permiten que conozca los últimos cambios en el mercado y reaccione a las pistas del mercado a tiempo. En nuestro servicio, siempre encontrará los últimos y más importantes patrones en cualquier par y en cualquier marco de tiempo.
Bullish Symmetrical Triangle
was formed on 15.04 at 02:04:07 (UTC+0)
signal strength 1 of 5
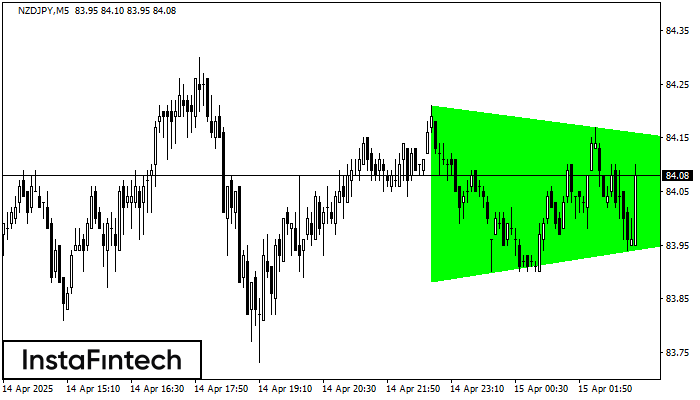
According to the chart of M5, NZDJPY formed the Bullish Symmetrical Triangle pattern. Description: This is the pattern of a trend continuation. 84.21 and 83.88 are the coordinates of the upper and lower borders respectively. The pattern width is measured on the chart at 33 pips. Outlook: If the upper border 84.21 is broken, the price is likely to continue its move by 84.21.
The M5 and M15 time frames may have more false entry points.
- All
- All
- Bearish Rectangle
- Bearish Symmetrical Triangle
- Bearish Symmetrical Triangle
- Bullish Rectangle
- Double Top
- Double Top
- Triple Bottom
- Triple Bottom
- Triple Top
- Triple Top
- All
- All
- Buy
- Sale
- All
- 1
- 2
- 3
- 4
- 5
Bullish Flag
was formed on 22.05 at 13:33:30 (UTC+0)
signal strength 3 of 5
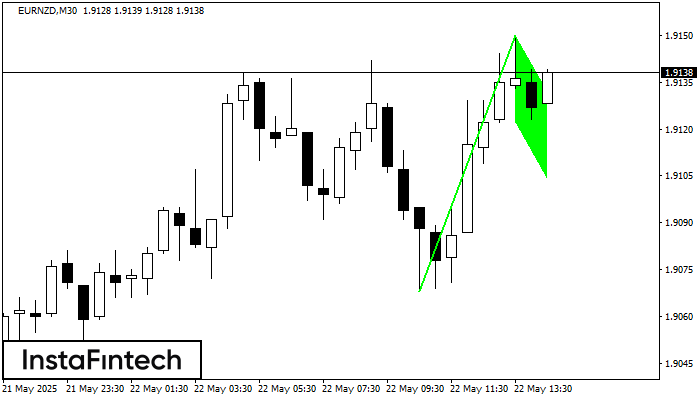
The Bullish Flag pattern has been formed on the chart EURNZD M30 which signals that the upward trend will continue. Signals: а break of the peak at 1.9150 may push
Open chart in a new window
Bullish pennant
was formed on 22.05 at 13:33:26 (UTC+0)
signal strength 3 of 5
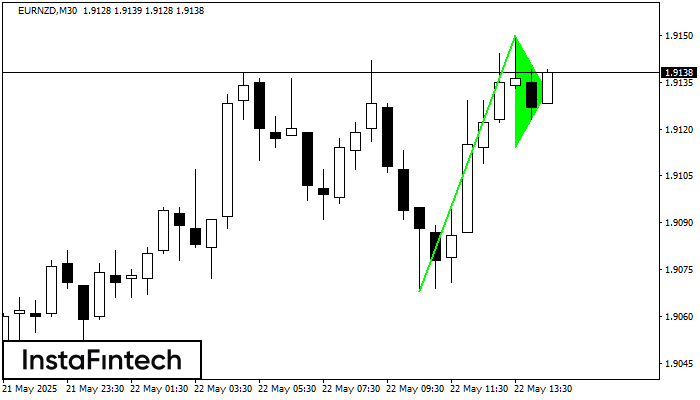
The Bullish pennant graphic pattern has formed on the EURNZD M30 instrument. This pattern type falls under the category of continuation patterns. In this case, if the quote can breaks
Open chart in a new window
Triple Bottom
was formed on 22.05 at 13:05:24 (UTC+0)
signal strength 1 of 5
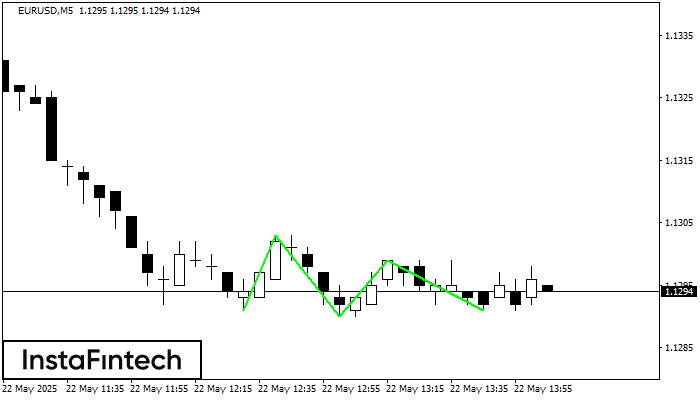
The Triple Bottom pattern has formed on the chart of EURUSD M5. Features of the pattern: The lower line of the pattern has coordinates 1.1303 with the upper limit 1.1303/1.1299
The M5 and M15 time frames may have more false entry points.
Open chart in a new window


