

Patrones actuales

Los patrones son modelos gráficos que se forman en el gráfico mediante el precio. Según uno de los postulados del análisis técnico, la historia (movimiento del precio) se repite. Esto quiere decir que los movimientos del precio a menudo son similares en las mismas situaciones que hacen posible pronosticar el futuro desarrollo de la situación con una alta probabilidad.
Los patrones relevantes de InstaTrade son un servicio fácil de utilizar que permiten que conozca los últimos cambios en el mercado y reaccione a las pistas del mercado a tiempo. En nuestro servicio, siempre encontrará los últimos y más importantes patrones en cualquier par y en cualquier marco de tiempo.
Bullish pennant
was formed on 14.04 at 16:00:24 (UTC+0)
signal strength 1 of 5
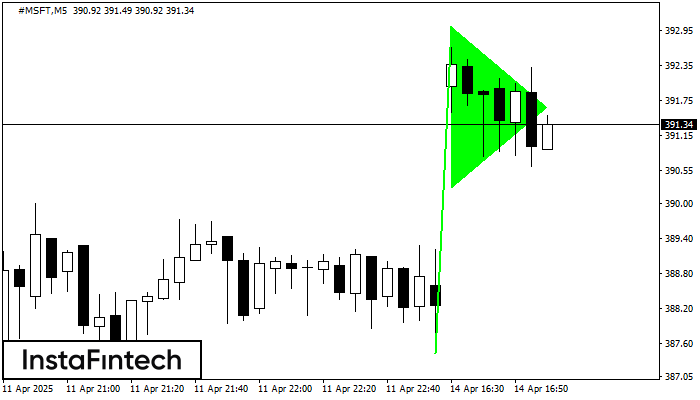
The Bullish pennant pattern is formed on the #MSFT M5 chart. It is a type of the continuation pattern. Supposedly, in case the price is fixed above the pennant’s high of 393.01, a further uptrend is possible.
The M5 and M15 time frames may have more false entry points.
- All
- All
- Bearish Rectangle
- Bearish Symmetrical Triangle
- Bearish Symmetrical Triangle
- Bullish Rectangle
- Double Top
- Double Top
- Triple Bottom
- Triple Bottom
- Triple Top
- Triple Top
- All
- All
- Buy
- Sale
- All
- 1
- 2
- 3
- 4
- 5
Teratas Triple
was formed on 22.05 at 15:45:19 (UTC+0)
signal strength 1 of 5
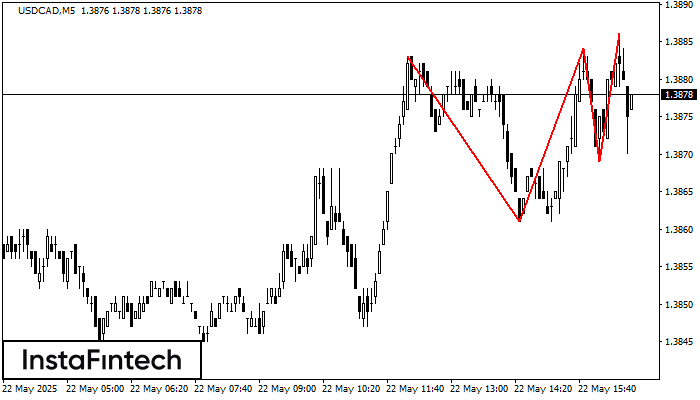
Pola Teratas Triple telah terbentuk pada grafik instrumen trading USDCAD M5. Pola tersebut merupakan pola reversal menampilkan karakteristik berikut: level resistance -3, levek support -8, dan lebar pola 22. Prakiraan
Rangka waktu M5 dan M15 mungkin memiliki lebih dari titik entri yang keliru.
Open chart in a new window
Teratas Ganda
was formed on 22.05 at 15:35:32 (UTC+0)
signal strength 1 of 5
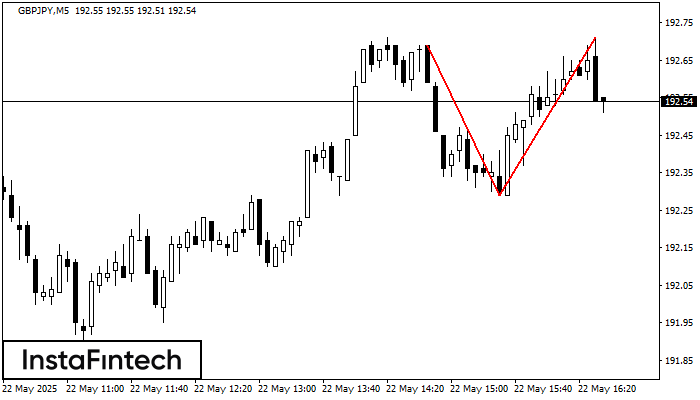
Pola reversal Teratas Ganda telah terbentuk pada GBPJPY M5. Karakteristik: batas atas 192.69; batas bawah 192.29; lebar pola 42 poin. Transaksi jual lebih baik dibuka di bawah batas bawah 192.29
Rangka waktu M5 dan M15 mungkin memiliki lebih dari titik entri yang keliru.
Open chart in a new window
Teratas Ganda
was formed on 22.05 at 15:30:26 (UTC+0)
signal strength 1 of 5
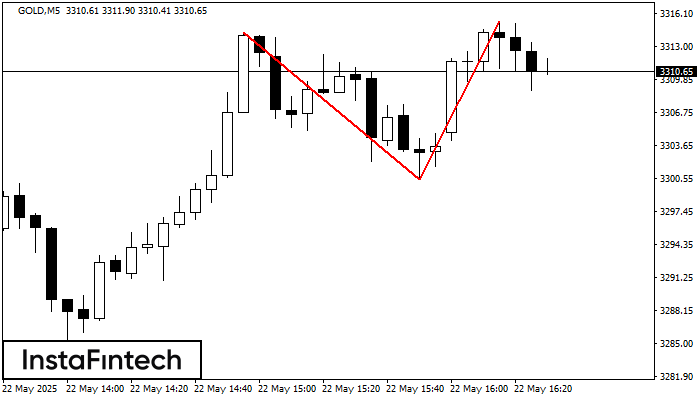
Pola Teratas Ganda telah terbentuk pada GOLD M5. Pola ini menandakan bahwa tren telah berubah dari kenaikan menjadi penurunan. Mungkin, jika dasar pola di 3300.45 ditembus, maka pergerakan menurun akan
Rangka waktu M5 dan M15 mungkin memiliki lebih dari titik entri yang keliru.
Open chart in a new window


