

Patrones actuales

Los patrones son modelos gráficos que se forman en el gráfico mediante el precio. Según uno de los postulados del análisis técnico, la historia (movimiento del precio) se repite. Esto quiere decir que los movimientos del precio a menudo son similares en las mismas situaciones que hacen posible pronosticar el futuro desarrollo de la situación con una alta probabilidad.
Los patrones relevantes de InstaTrade son un servicio fácil de utilizar que permiten que conozca los últimos cambios en el mercado y reaccione a las pistas del mercado a tiempo. En nuestro servicio, siempre encontrará los últimos y más importantes patrones en cualquier par y en cualquier marco de tiempo.
Double Top
was formed on 11.04 at 22:10:22 (UTC+0)
signal strength 1 of 5

On the chart of #Bitcoin M5 the Double Top reversal pattern has been formed. Characteristics: the upper boundary 83924.61; the lower boundary 83599.60; the width of the pattern 32501 points. The signal: a break of the lower boundary will cause continuation of the downward trend targeting the 83599.45 level.
The M5 and M15 time frames may have more false entry points.
- All
- All
- Bearish Rectangle
- Bearish Symmetrical Triangle
- Bearish Symmetrical Triangle
- Bullish Rectangle
- Double Top
- Double Top
- Triple Bottom
- Triple Bottom
- Triple Top
- Triple Top
- All
- All
- Buy
- Sale
- All
- 1
- 2
- 3
- 4
- 5
Double Bottom
was formed on 22.05 at 10:30:10 (UTC+0)
signal strength 3 of 5
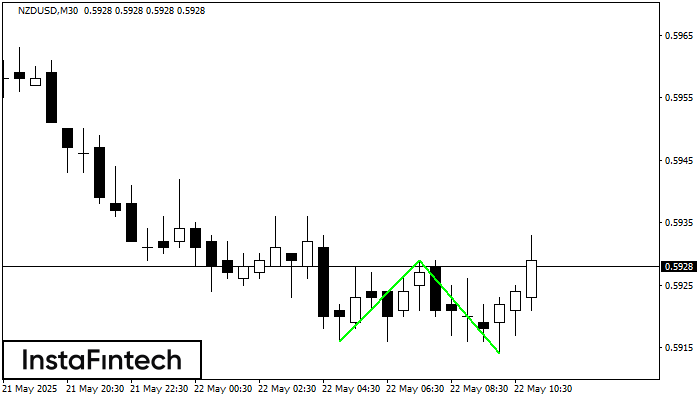
The Double Bottom pattern has been formed on NZDUSD M30. Characteristics: the support level 0.5916; the resistance level 0.5929; the width of the pattern 13 points. If the resistance level
Open chart in a new window
Double Bottom
was formed on 22.05 at 10:30:07 (UTC+0)
signal strength 2 of 5
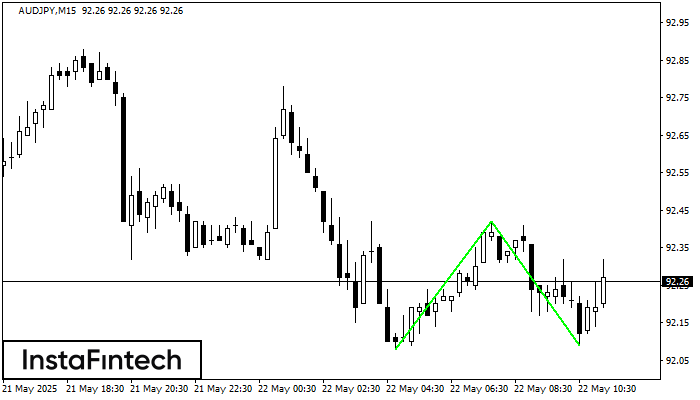
The Double Bottom pattern has been formed on AUDJPY M15. Characteristics: the support level 92.08; the resistance level 92.42; the width of the pattern 34 points. If the resistance level
The M5 and M15 time frames may have more false entry points.
Open chart in a new window
Double Bottom
was formed on 22.05 at 10:25:09 (UTC+0)
signal strength 1 of 5
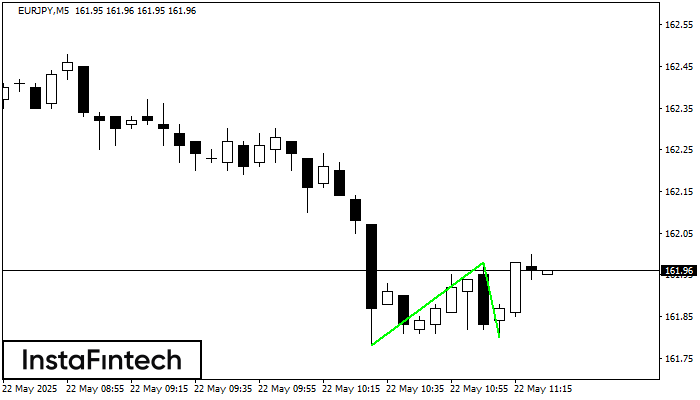
The Double Bottom pattern has been formed on EURJPY M5. Characteristics: the support level 161.78; the resistance level 161.98; the width of the pattern 20 points. If the resistance level
The M5 and M15 time frames may have more false entry points.
Open chart in a new window


