

Patrones actuales

Los patrones son modelos gráficos que se forman en el gráfico mediante el precio. Según uno de los postulados del análisis técnico, la historia (movimiento del precio) se repite. Esto quiere decir que los movimientos del precio a menudo son similares en las mismas situaciones que hacen posible pronosticar el futuro desarrollo de la situación con una alta probabilidad.
Los patrones relevantes de InstaTrade son un servicio fácil de utilizar que permiten que conozca los últimos cambios en el mercado y reaccione a las pistas del mercado a tiempo. En nuestro servicio, siempre encontrará los últimos y más importantes patrones en cualquier par y en cualquier marco de tiempo.
Bearish pennant
was formed on 08.04 at 15:30:16 (UTC+0)
signal strength 4 of 5
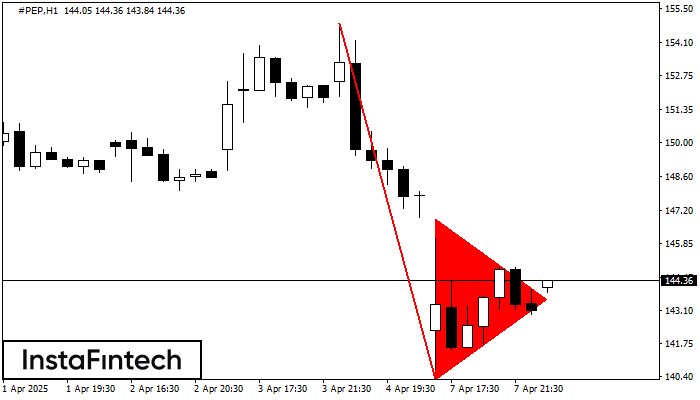
The Bearish pennant pattern has formed on the #PEP H1 chart. This pattern type is characterized by a slight slowdown after which the price will move in the direction of the original trend. In case the price fixes below the pattern’s low of 140.24, a trader will be able to successfully enter the sell position.
Vea asimismo
- All
- All
- Bearish Rectangle
- Bearish Symmetrical Triangle
- Bearish Symmetrical Triangle
- Bullish Rectangle
- Double Top
- Double Top
- Triple Bottom
- Triple Bottom
- Triple Top
- Triple Top
- All
- All
- Buy
- Sale
- All
- 1
- 2
- 3
- 4
- 5
Triángulo Simétrico Bajista
was formed on 21.05 at 11:46:23 (UTC+0)
signal strength 3 of 5
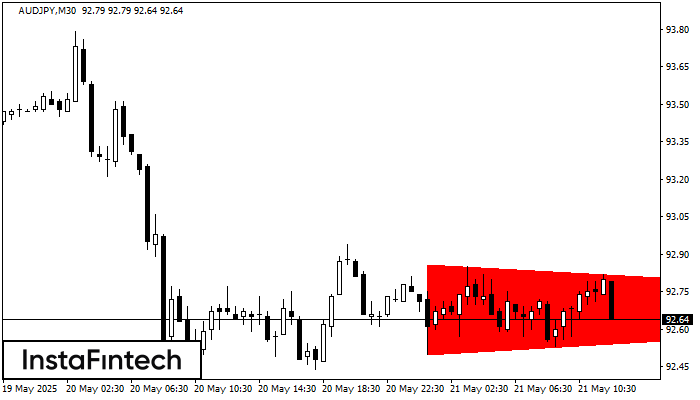
Según el gráfico de M30, el AUDJPY formó el patrón Triángulo Simétrico Bajista. Este patrón señala una tendencia bajista en caso de que el límite inferior 92.50 sea roto. Aquí
Open chart in a new window
Doble Techo
was formed on 21.05 at 11:35:20 (UTC+0)
signal strength 1 of 5
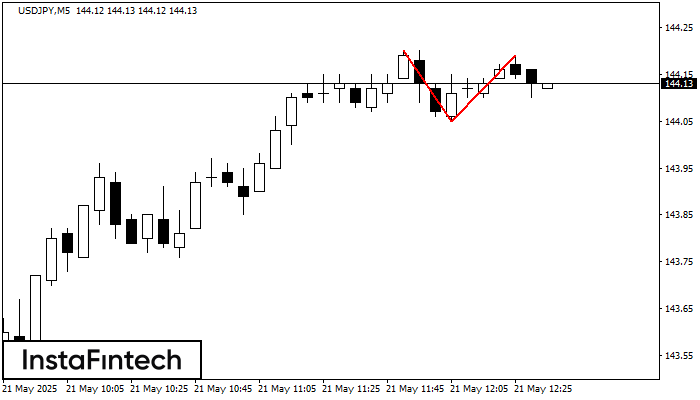
En el gráfico de USDJPY M5 el patrón de reversión Doble Techo ha sido formado. Características: límite superior 144.19; límite inferior 144.05; el ancho del patrón 14 puntos. La señal
Los marcos de tiempo M5 y M15 pueden tener más puntos de entrada falsos.
Open chart in a new window
Rectángulo Alcista
was formed on 21.05 at 11:35:00 (UTC+0)
signal strength 1 of 5
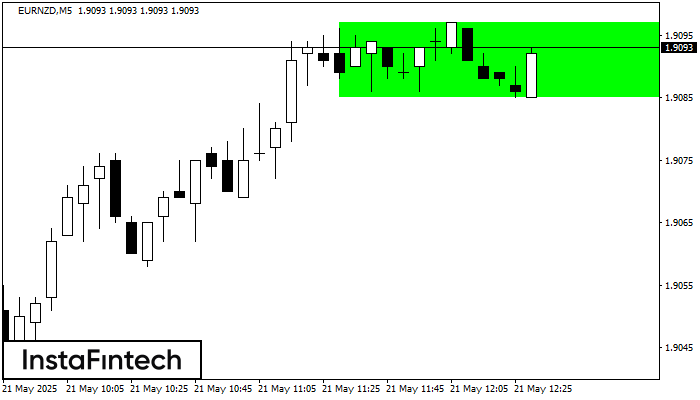
Según el gráfico de M5, EURNZD formó el Rectángulo Alcista que es un patrón de la continuación de una tendencia. El patrón está contenido dentro de los siguientes límites
Los marcos de tiempo M5 y M15 pueden tener más puntos de entrada falsos.
Open chart in a new window


