

Patrones actuales

Los patrones son modelos gráficos que se forman en el gráfico mediante el precio. Según uno de los postulados del análisis técnico, la historia (movimiento del precio) se repite. Esto quiere decir que los movimientos del precio a menudo son similares en las mismas situaciones que hacen posible pronosticar el futuro desarrollo de la situación con una alta probabilidad.
Los patrones relevantes de InstaTrade son un servicio fácil de utilizar que permiten que conozca los últimos cambios en el mercado y reaccione a las pistas del mercado a tiempo. En nuestro servicio, siempre encontrará los últimos y más importantes patrones en cualquier par y en cualquier marco de tiempo.
Bullish Symmetrical Triangle
was formed on 08.04 at 14:47:55 (UTC+0)
signal strength 3 of 5
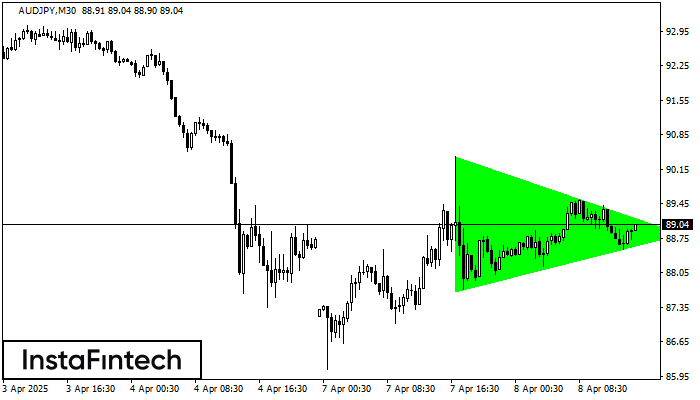
According to the chart of M30, AUDJPY formed the Bullish Symmetrical Triangle pattern. Description: This is the pattern of a trend continuation. 90.41 and 87.68 are the coordinates of the upper and lower borders respectively. The pattern width is measured on the chart at 273 pips. Outlook: If the upper border 90.41 is broken, the price is likely to continue its move by 89.12.
Vea asimismo
- All
- All
- Bearish Rectangle
- Bearish Symmetrical Triangle
- Bearish Symmetrical Triangle
- Bullish Rectangle
- Double Top
- Double Top
- Triple Bottom
- Triple Bottom
- Triple Top
- Triple Top
- All
- All
- Buy
- Sale
- All
- 1
- 2
- 3
- 4
- 5
Cabeza y Hombros Inverso
was formed on 21.05 at 10:40:34 (UTC+0)
signal strength 1 of 5
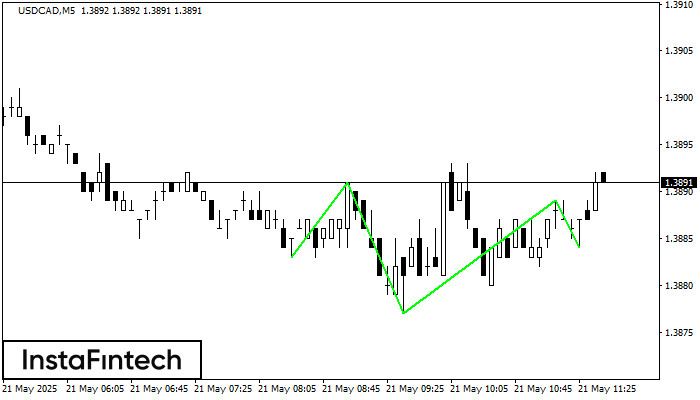
Según el gráfico de M5, USDCAD formó el patrón Cabeza y Hombros Inverso. El techo de la Cabeza está establecido en 1.3889 mientras la línea media del Cuello se encuentra
Los marcos de tiempo M5 y M15 pueden tener más puntos de entrada falsos.
Open chart in a new window
Triple Piso
was formed on 21.05 at 10:00:16 (UTC+0)
signal strength 4 of 5
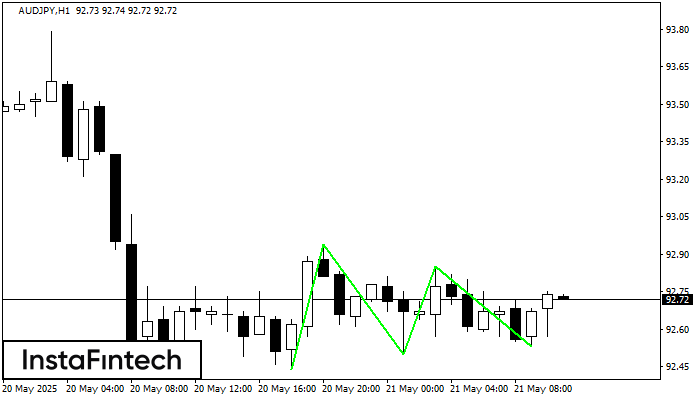
El patrón Triple Piso ha sido formado en AUDJPY H1. Este tiene las siguientes características: nivel de resistencia 92.94/92.85; nivel de soporte 92.44/92.53; el ancho es 50 puntos. En caso
Open chart in a new window
Doble Piso
was formed on 21.05 at 10:00:05 (UTC+0)
signal strength 3 of 5
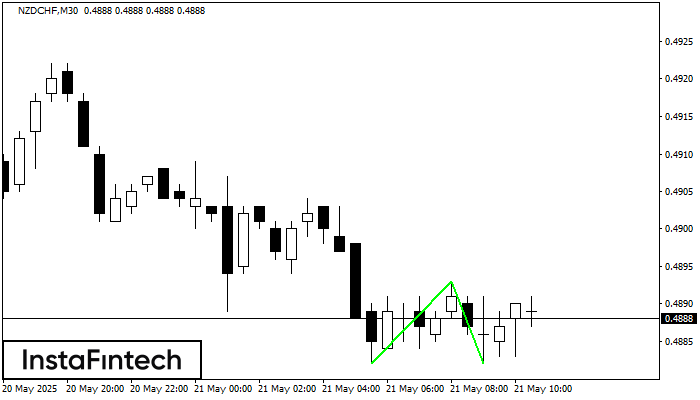
El patrón Doble Piso ha sido formado en NZDCHF M30. Características: el nivel de soporte 0.4882; el nivel de resistencia 0.4893; el ancho del patrón 11 puntos. Si el nivel
Open chart in a new window


