

Patrones actuales

Los patrones son modelos gráficos que se forman en el gráfico mediante el precio. Según uno de los postulados del análisis técnico, la historia (movimiento del precio) se repite. Esto quiere decir que los movimientos del precio a menudo son similares en las mismas situaciones que hacen posible pronosticar el futuro desarrollo de la situación con una alta probabilidad.
Los patrones relevantes de InstaTrade son un servicio fácil de utilizar que permiten que conozca los últimos cambios en el mercado y reaccione a las pistas del mercado a tiempo. En nuestro servicio, siempre encontrará los últimos y más importantes patrones en cualquier par y en cualquier marco de tiempo.
Bearish Symmetrical Triangle
was formed on 08.04 at 12:30:45 (UTC+0)
signal strength 4 of 5
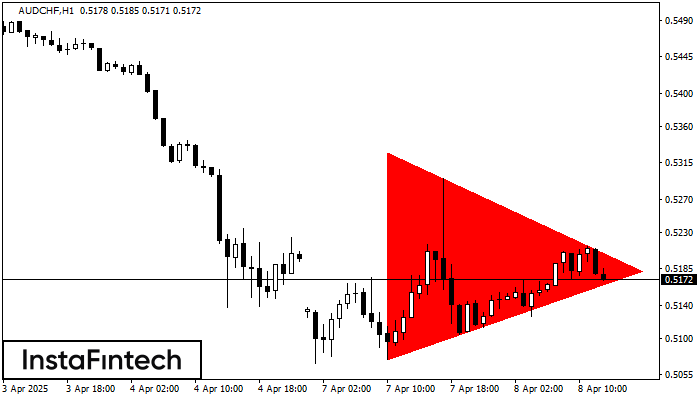
According to the chart of H1, AUDCHF formed the Bearish Symmetrical Triangle pattern. Description: The lower border is 0.5074/0.5182 and upper border is 0.5328/0.5182. The pattern width is measured on the chart at -254 pips. The formation of the Bearish Symmetrical Triangle pattern evidently signals a continuation of the downward trend. In other words, if the scenario comes true and AUDCHF breaches the lower border, the price could continue its move toward 0.5142.
Vea asimismo
- All
- All
- Bearish Rectangle
- Bearish Symmetrical Triangle
- Bearish Symmetrical Triangle
- Bullish Rectangle
- Double Top
- Double Top
- Triple Bottom
- Triple Bottom
- Triple Top
- Triple Top
- All
- All
- Buy
- Sale
- All
- 1
- 2
- 3
- 4
- 5
Doble Piso
was formed on 22.05 at 02:30:50 (UTC+0)
signal strength 3 of 5
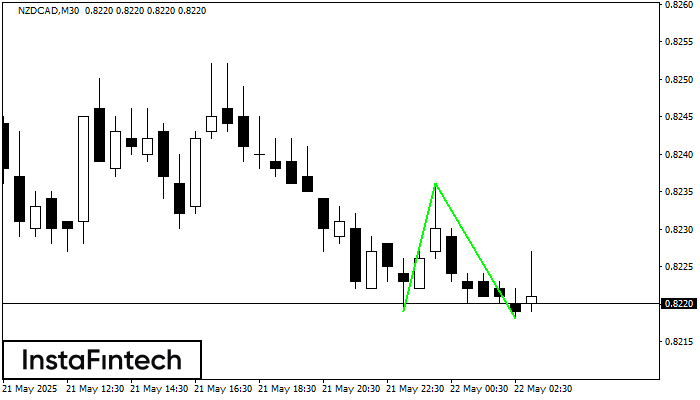
El patrón Doble Piso ha sido formado en NZDCAD M30. Características: el nivel de soporte 0.8219; el nivel de resistencia 0.8236; el ancho del patrón 17 puntos. Si el nivel
Open chart in a new window
Doble Techo
was formed on 22.05 at 02:30:14 (UTC+0)
signal strength 2 of 5
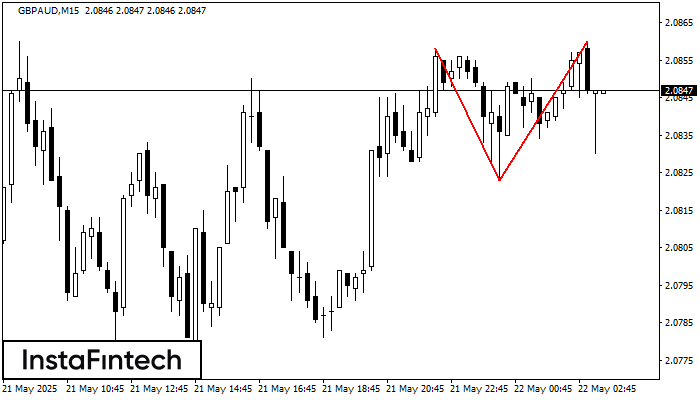
El patrón Doble Techo ha sido formado en GBPAUD M15. Esto señala que la tendencia ha sido cambiada de alcista a bajista. Probablemente, si la base del patrón 2.0823
Los marcos de tiempo M5 y M15 pueden tener más puntos de entrada falsos.
Open chart in a new window
Triángulo Simétrico Alcista
was formed on 22.05 at 02:03:55 (UTC+0)
signal strength 1 of 5
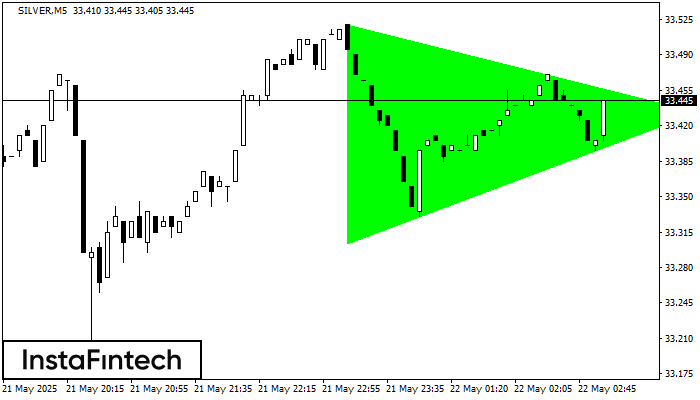
Según el gráfico de M5, SILVER formó el patrón Triángulo Simétrico Alcista, que señala que la tendencia continuará. Descripción. El límite superior del patrón toca las coordenadas 33.52/33.43 donde
Los marcos de tiempo M5 y M15 pueden tener más puntos de entrada falsos.
Open chart in a new window


